|
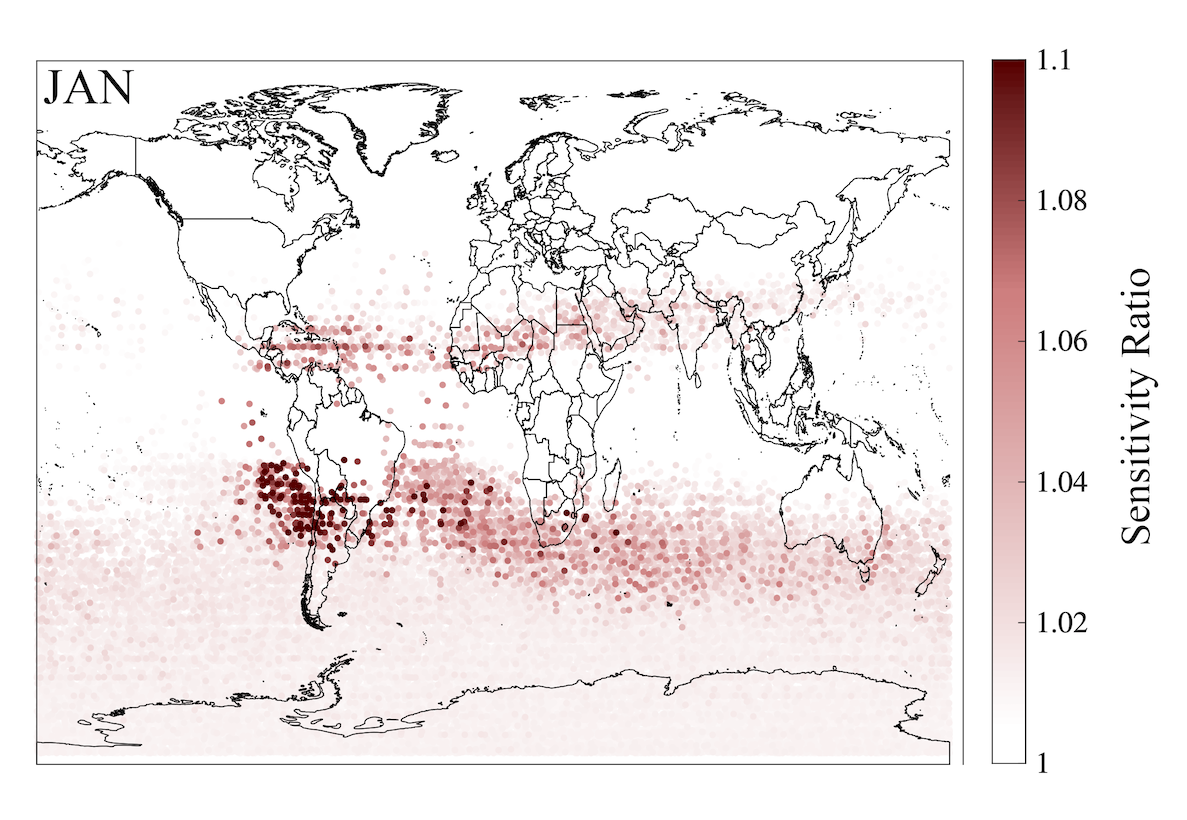
MIPAS / GEOS-Chem Analysis Raw Data New
Time span: 2004 through 2012 Time resolution: Monthly Spatial extent: global Spatial Resolution: n/a Files: ocs_mipas_geos_chem.zip (37 MB) contains monthly CSV files for each month of OCS concentrations measured by MIPAS and simulated using GEOS-Chem. Each file contains the latitude/longitude for the MIPAS observation, the retrieved value from MIPAS, as well as the model values at the same location extracted from 3 simulations with different surface fluxes. Full model output (ca. 200GB) is available on request. Publication: Stinecipher, J. R., P. J. Cameron-Smith, L. Kuai, N. Glatthor, M. Höpfner, I. Baker, C. Beer, K. Bowman, M. Lee, S. M. Miller, N. Parazoo, J. E. Campbell (2022), Remotely Sensed Carbonyl Sulfide Constrains Model Estimates of Amazon Primary Productivity. Geophysical Research Letters, 49, e2021GL096802. doi:10.1029/2021GL096802. |
| Campbell Lab Data Sharing |
|
Global gridded biomass burning fluxes of
carbonyl sulfide
Time span: 1997 through 2016 Time resolution: Monthly Spatial extent: global Spatial Resolution: 2x2.5 degree Files: ocs_bmb_global_resolution_2x2_5.zip (31 MB) contains 80 netCDF files, containing temporally and spatially resolved carbonyl sulfide (OCS) fluxes for the following biomass burning categories, based on GFED burned matter estimates:
Publication: Stinecipher, J. R., P. J. Cameron-Smith, N. J. Blake, L. Kuai, B. Lejeune, E. Mahieu, I. J. Simpson, and J. E. Campbell (2019), Biomass burning unlikely to account for missing source of carbonyl sulfide. Geophysical Research Letters, 46, 14,912-14,920. doi:10.1029/2019GL085567. |
|
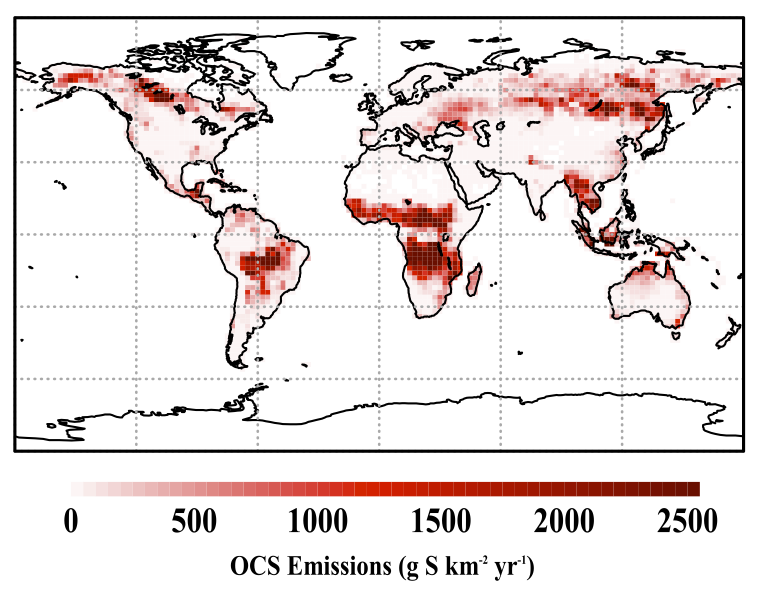
Global gridded anthropogenic emissions inventory of
carbonyl sulfide
Time span: 1980 through 2012 Spatial extent: global Spatial Resolution: 0.1 degree Files: anth_COS_global_resolution_0.1x0.1.zip (512 MB) contains 12 netCDF files, each 812MB, containing temporally and spatially resolved carbonyl sulfide (OCS) source data for the following anthropogenic sources:
Publications: Zumkehr, A., T. Hilton, M. Whelan, S. Smith, L. Kuai, J. Worden, and J. E. Campbell (2018), Global gridded anthropogenic emissions inventory of carbonyl sulfide, Atmospheric Environment, doi:10.1016/j.atmosenv.2018.03.063. |
|
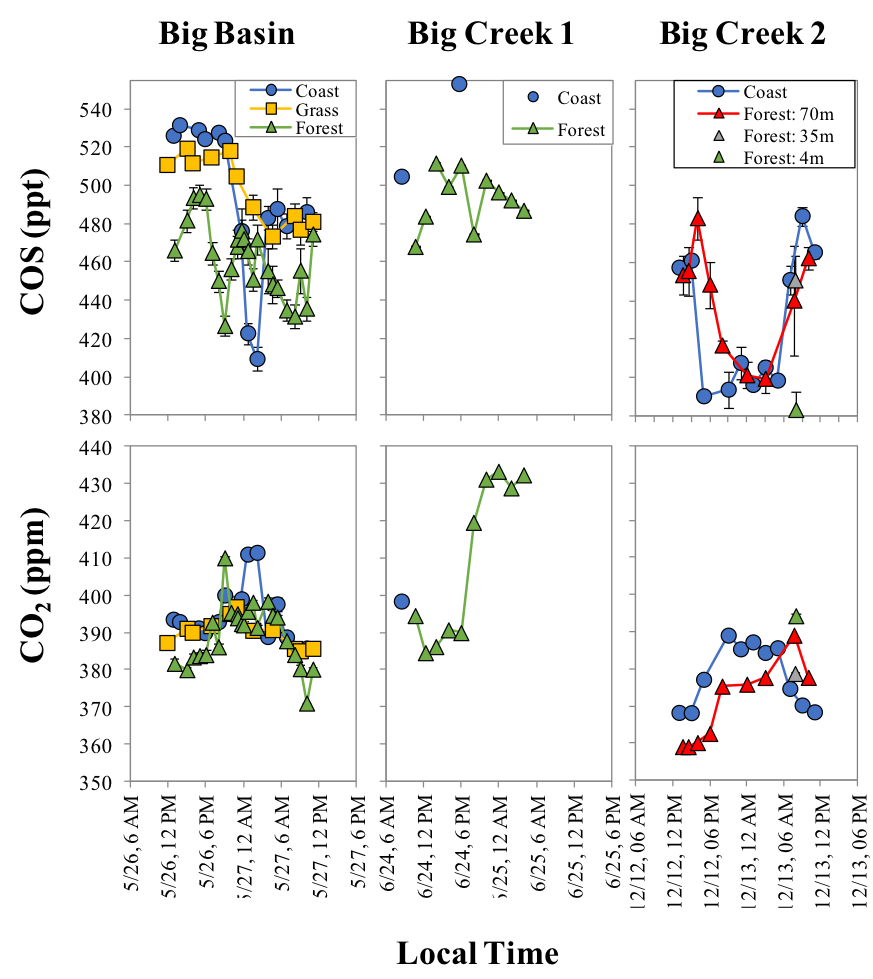
California Coastal Redwood OCS, CO2 Concentration Data Publications: Campbell, J. E., M. E. Whelan, J. A. Berry, T. W. Hilton, A. Zumkehr, J. Stinecipher, Y. Lu, A. Kornfeld, U. Seibt, T. E. Dawson, S. A. Montzka, I. T. Baker, S. Kulkarni, Y. Wang, S. C. Herndon, M. S. Zahniser, R. Commane, and M. E. Loik (2017), Plant Uptake of Atmospheric Carbonyl Sulfide in Coast Redwood Forests, Journal of Geophysical Research: Biogeosciences, 122(11), 2016JG003703, doi:10.1002/2016JG003703. |
|
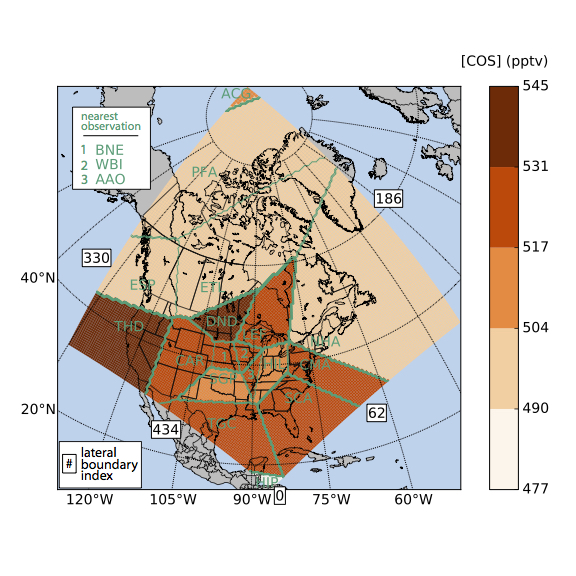
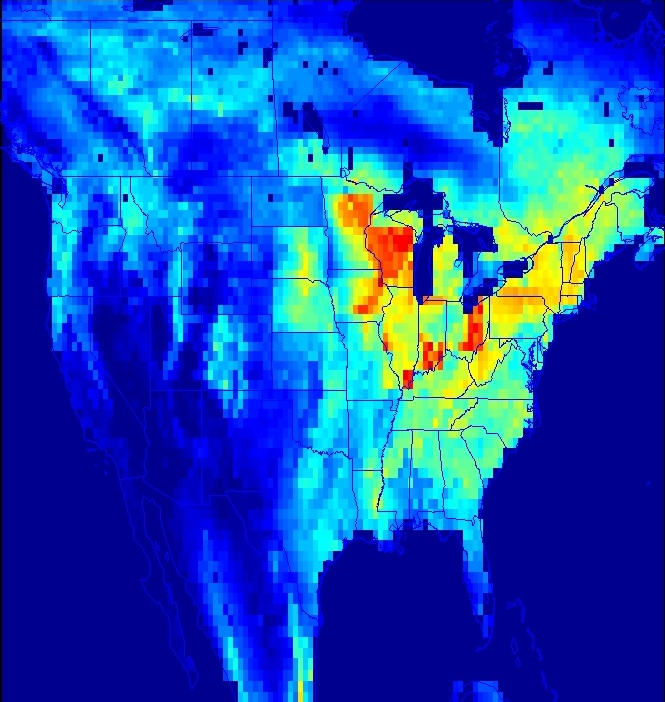
STEM Meteorological Driver Data Time span: 29 Feb 2008 to 2 Aug 2009 Spatial extent: Coterminus USA and most of Canada Spatial Resolution: 60 km by 60 km Projection: North Pole Stereographic. More information on the domain and projection provided by D'Allura et al (2011). All files are netCDF files in Models-3/EDSS I/O API-compatible format. Climatological boundary conditions are described in Hilton et al. (2016) supplementary materials section 1.4 and figures S4 and S5. Files:Topography, latitude, longitude (313 KB), WRF level heights (5.3 GB), WRF meteorological driver data (26 GB), Climatological lateral boundaries (54 KB), Climatological vertical OCS boundary conditions (71 K), Whelan-Kettle "hybrid" OCS soil flux (123 MB) Publications: D'Allura, A., S. Kulkarni, G. R. Carmichael, S. Finardi, B. Adhikary, C. Wei, D. Streets, Q. Zhang, R. B. Pierce, J. A. Al-Saadi, G. Diskin, and P. Wennberg (2011), Meteorological and air quality forecasting using the WRF-STEM model during the 2008 ARCTAS field campaign, Atmospheric Environment, 45(38), 6901-6910, doi:10.1016/j.atmosenv.2011.02.073. Hilton, T. W., A. Zumkehr, S. Kulkarni, J. Berry, M. E. Whelan, and J. E. Campbell (2015), Large variability in ecosystem models explains uncertainty in a critical parameter for quantifying GPP with carbonyl sulphide, Tellus B, 67(0), doi:10.3402/tellusb.v67.26329. Hilton, T. W., M. E. Whelan, A. Zumkehr, S. Kulkarni, J. A. Berry, I. T. Baker, S. A. Montzka, C. Sweeney, B. R. Miller, and J. Elliott Campbell (2017), Peak growing season gross uptake of carbon in North America is largest in the Midwest USA, Nature Clim. Change, 7(6), 450-454, doi:10.1038/nclimate3272. |
|
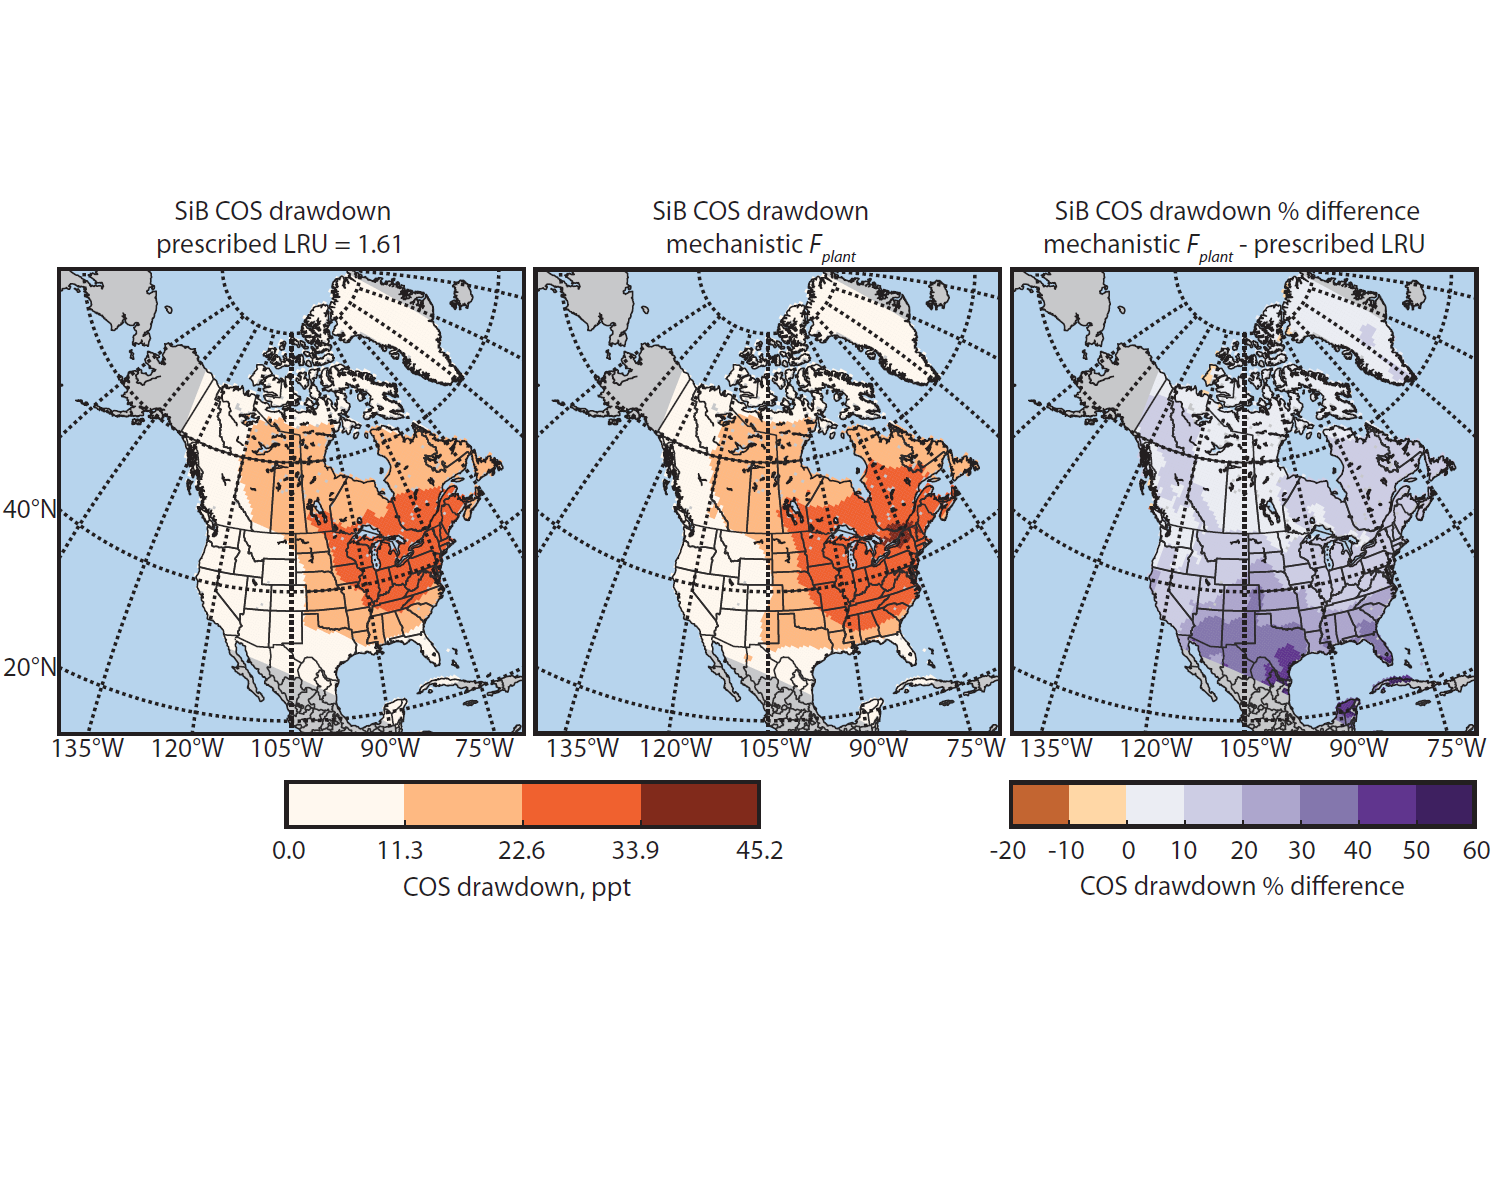
SiB3 simulations of gross primary productivity(GPP) and carbonyl sulfide (OCS) plant flux Time span: 1 July 2008 through 31 Aug 2008 Spatial extent: Coterminus USA and most of Canada Spatial Resolution: 60 km by 60 km Publication: Berry, J., A. Wolf, J. E. Campbell, I. Baker, N. Blake, D. Blake, A. S. Denning, S. R. Kawa, S. A. Montzka, U. Seibt, K. Stimler, D. Yakir, and Z. Zhu (2013), A coupled model of the global cycles of carbonyl sulfide and CO2: A possible new window on the carbon cycle, Journal of Geophysical Research: Biogeosciences, 118(2), 842 Hilton, T. W., A. Zumkehr, S. Kulkarni, J. Berry, M. E. Whelan, and J. E. Campbell (2015), Large variability in ecosystem models explains uncertainty in a critical parameter for quantifying GPP with carbonyl sulphide, Tellus B, 67(0), doi:10.3402/tellusb.v67.26329. Hilton, T. W., M. E. Whelan, A. Zumkehr, S. Kulkarni, J. A. Berry, I. T. Baker, S. A. Montzka, C. Sweeney, B. R. Miller, and J. Elliott Campbell (2017), Peak growing season gross uptake of carbon in North America is largest in the Midwest USA, Nature Clim. Change, 7(6), 450-454, doi:10.1038/nclimate3272. |
|
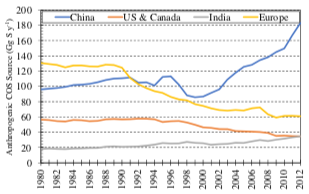
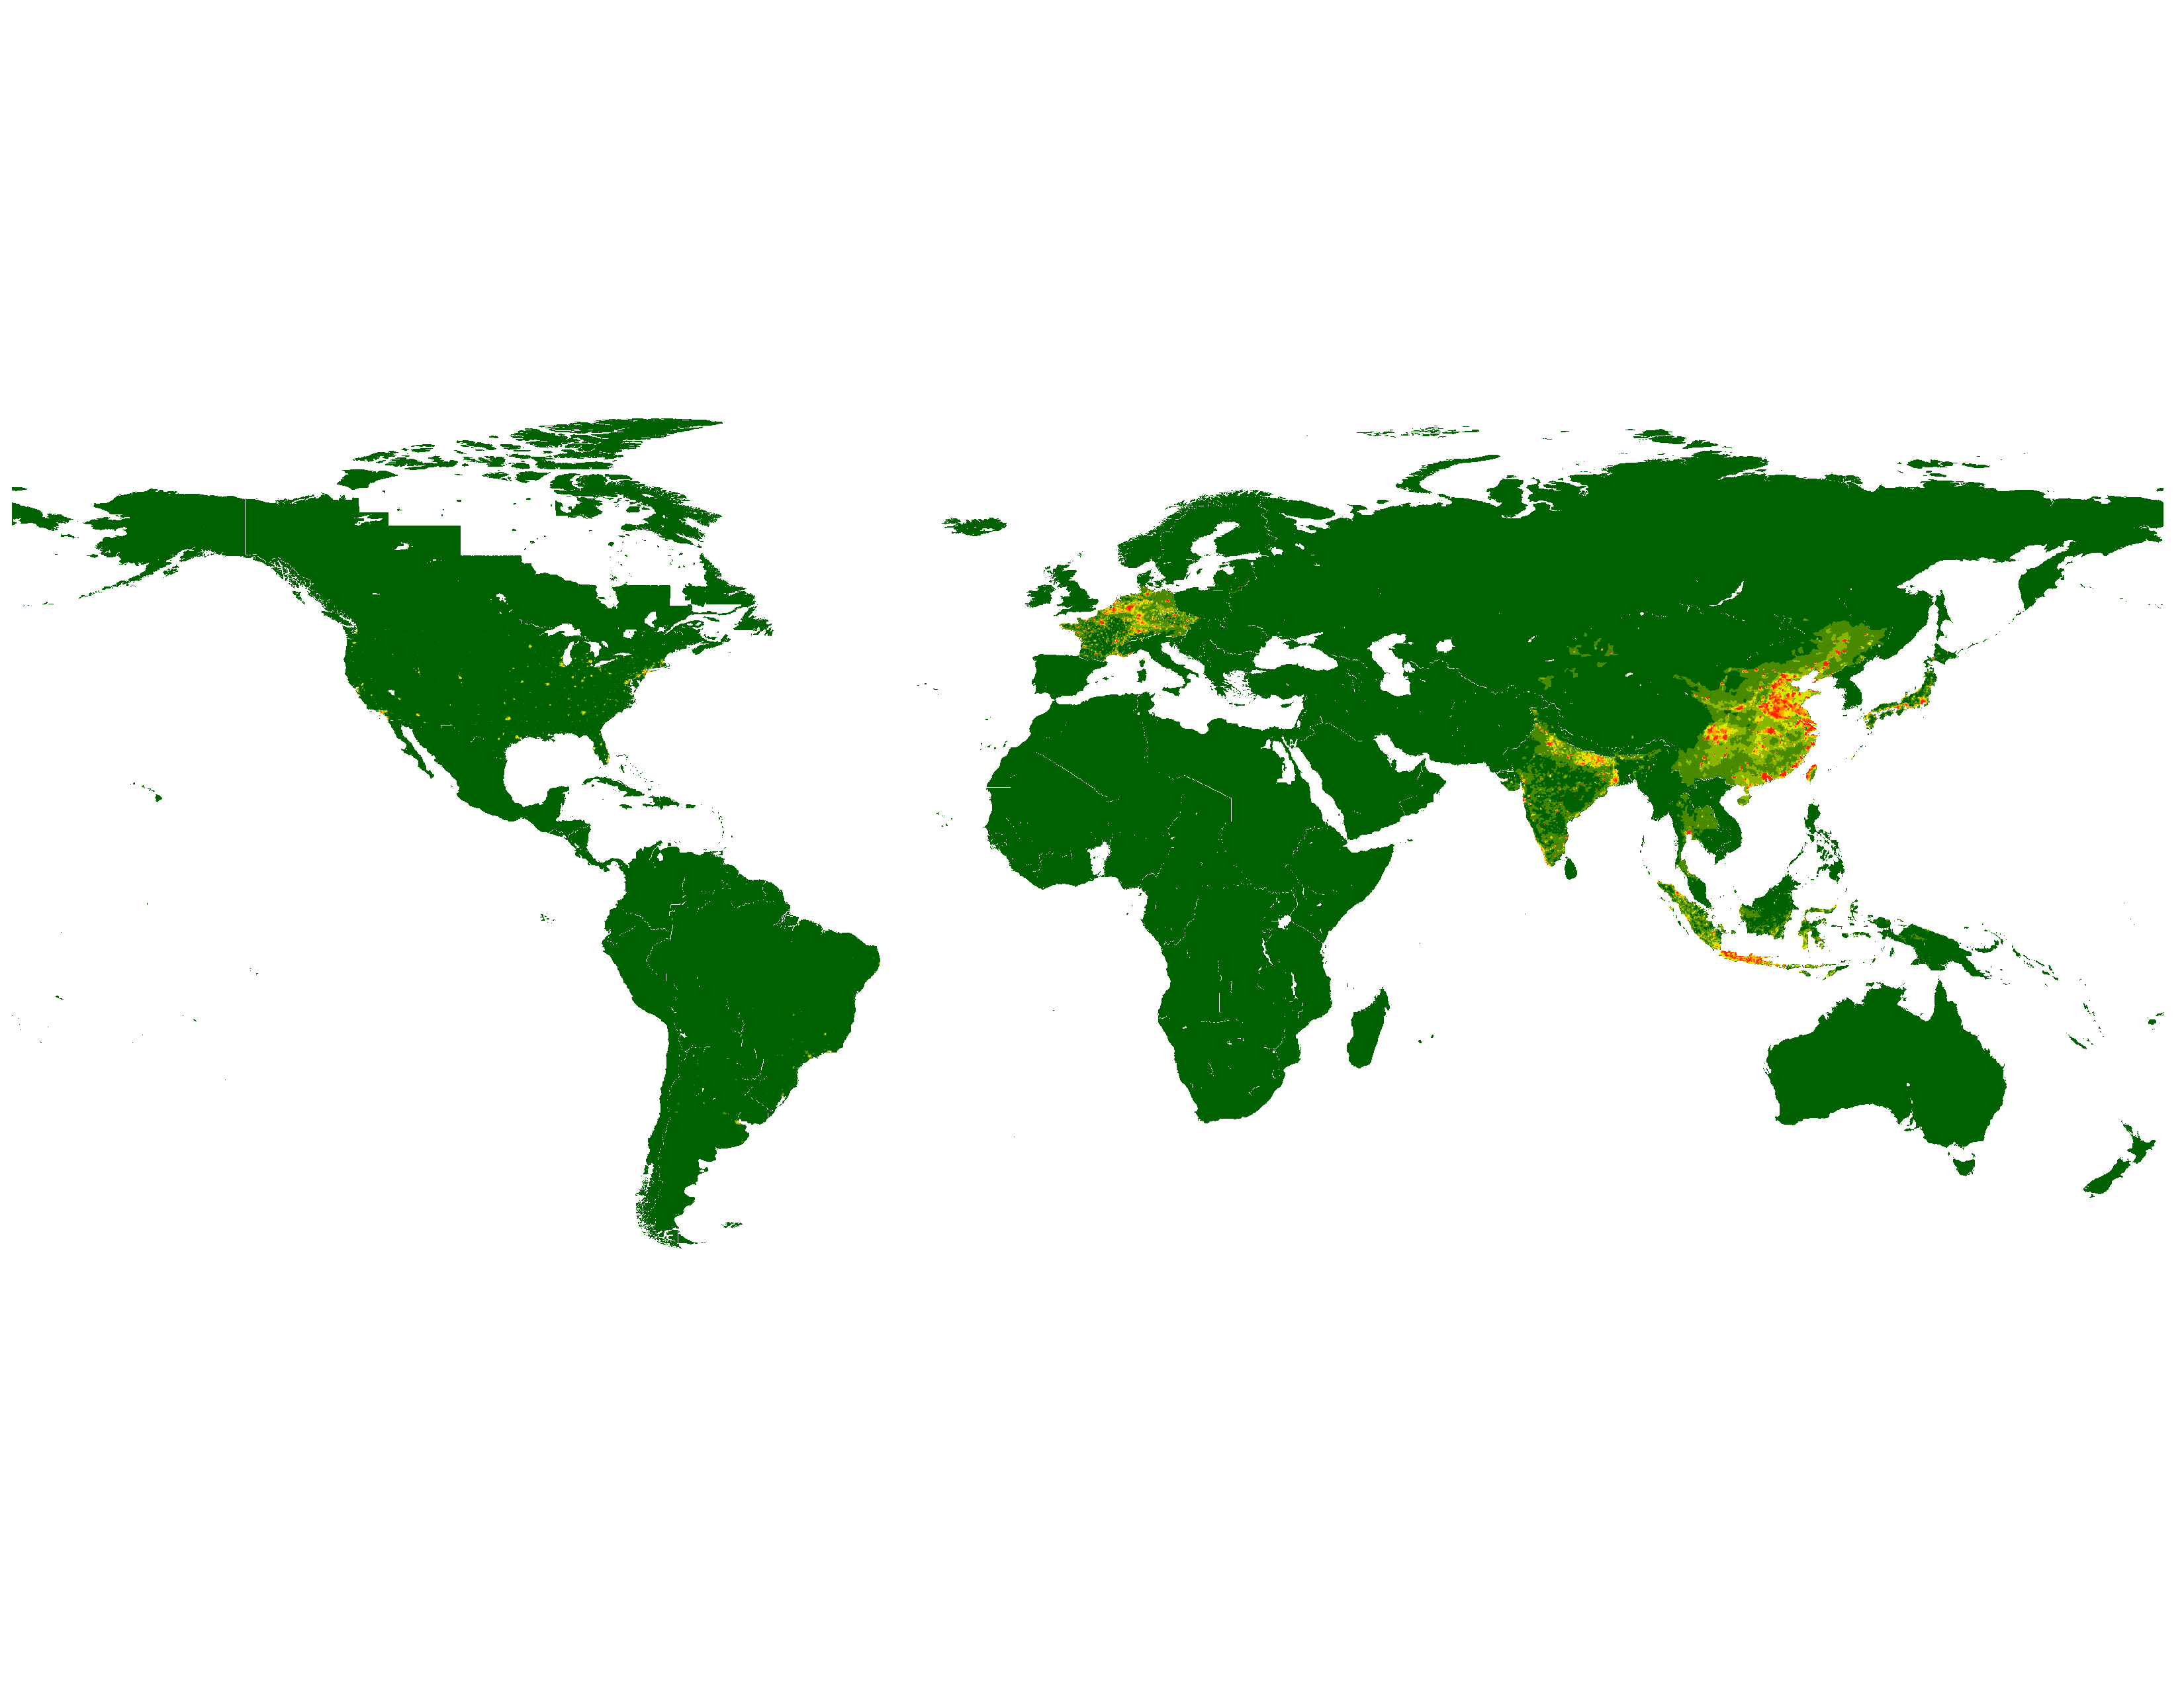
Global Anthropogenic Carbonyl Sulfide Surface Fluxes Version 1.0 Time span: 2013 Temporal resolution: 1yr Spatial extent: Global Spatial Resolution: 0.1 degree Note: The spatial scaling in Version 1.0 is based on rayon production only which is the dominant anthropogenic source of atmospheric carbonyl sulfide. This spatial scaling is concentrated in China. The previously available source inventory from Kettle et al. (2002) is more evenly spread across the world because it is based on data that is three or more decades old (see reference below, Campbell et al., GRL, 2015). For more information please refer to this paper: Atmospheric carbonyl sulfide sources from anthropogenic activity: Implications for carbon cycle constraints Publication: Campbell, J. E., Whelan, M. E., Seibt, U., Smith, S. J., Berry, J. A., & Hilton, T. W. (2015). Atmospheric carbonyl sulfide sources from anthropogenic activity: Implications for carbon cycle constraints. Geophysical Research Letters, 42(8), 3004-3010. DOI: 10.1002/2015GL063445. |
|
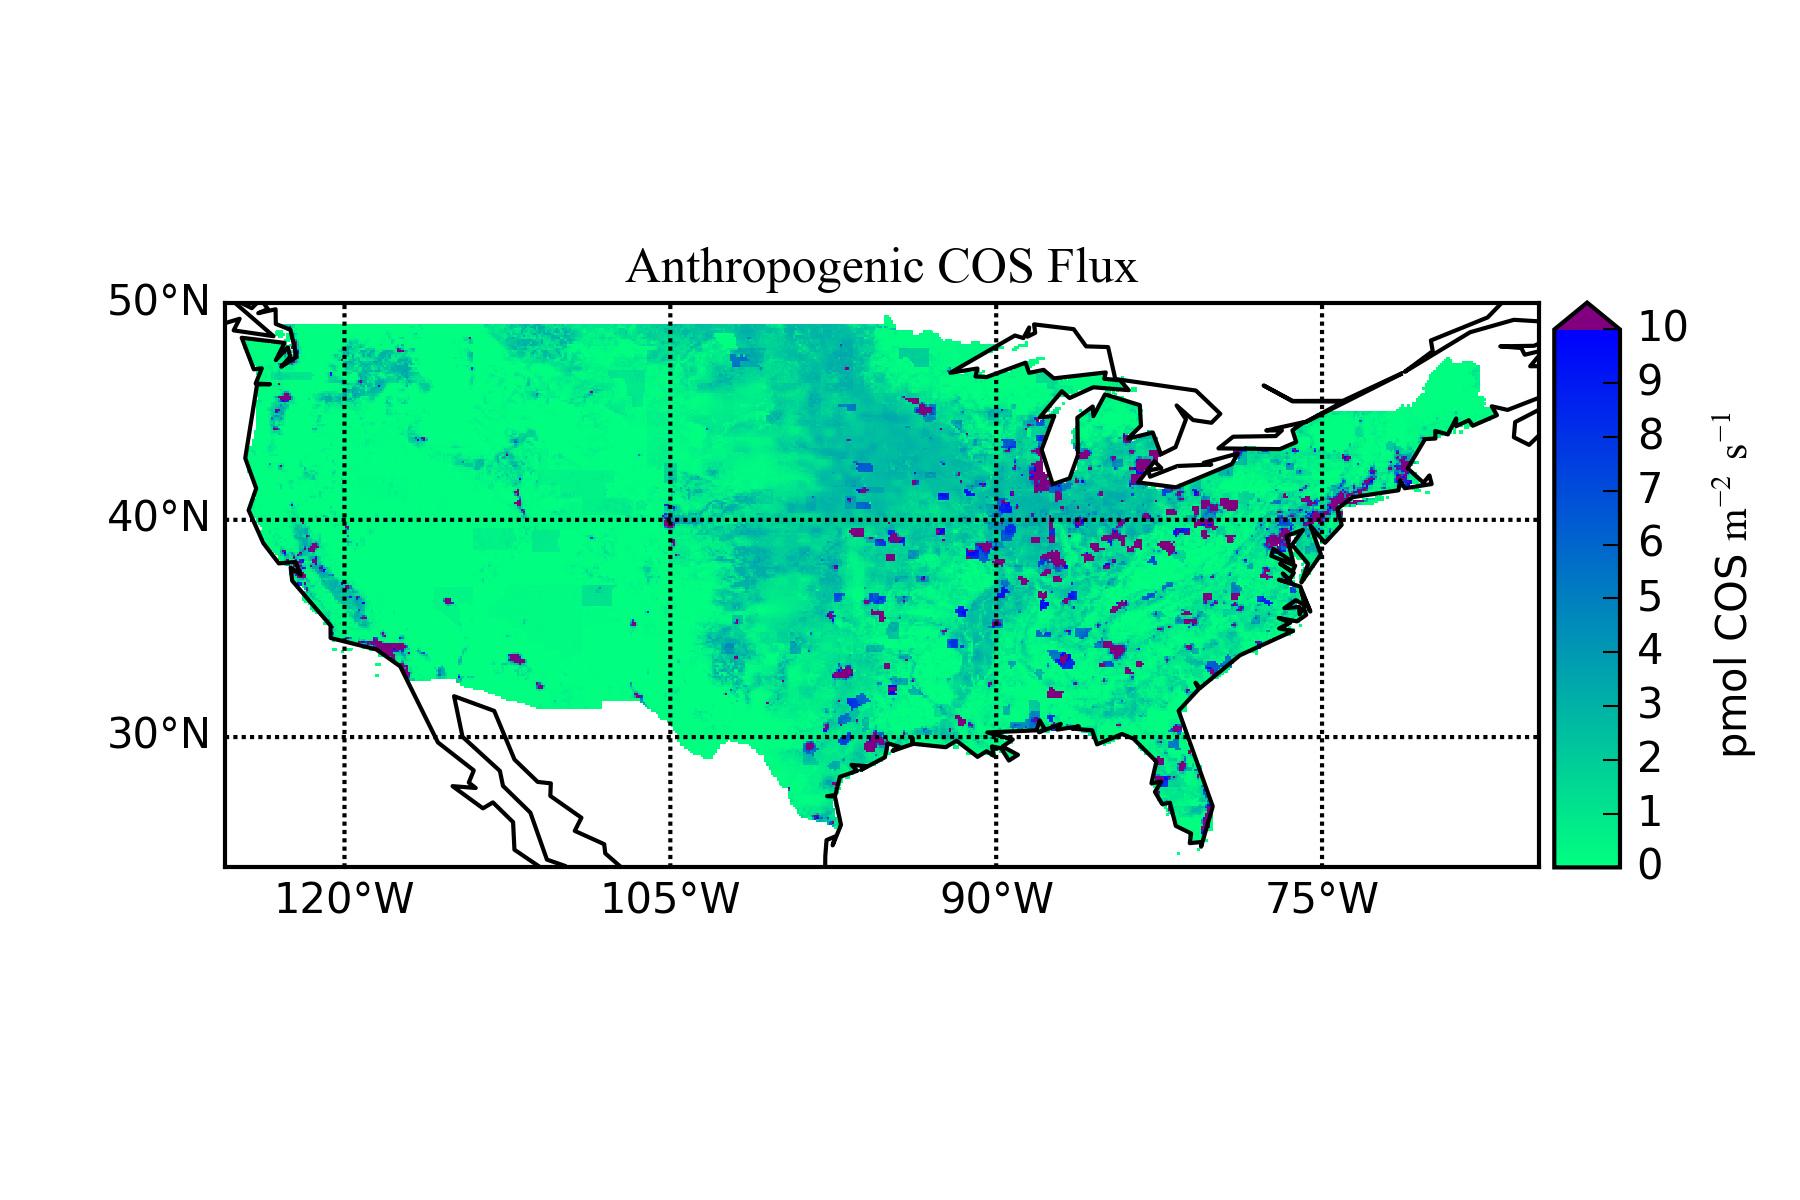
U.S. Anthropogenic Carbonyl Sulfide Fluxes Time Span: 2010* Temporal resolution: 1yr Spatial extent: Conterminous U.S. Spatial Resolution: 0.1 degree Publications: Zumkehr, A., Hilton, T. W., Whelan, M., Smith, S. Campbell, J. E., (in review, 2016). Gridded anthropogenic emissions inventory and atmospheric transport of carbonyl sulfide in the 1 U.S. Journal of Geophysical Research: Atmpospheres. Campbell, J. E., Whelan, M. E., Seibt, U., Smith, S. J., Berry, J. A., & Hilton, T. W. (2015). Atmospheric carbonyl sulfide sources from anthropogenic activity: Implications for carbon cycle constraints. Geophysical Research Letters, 42(8), 3004–3010. http://doi.org/10.1002/2015GL063445 *see notes in attached readme file |
|
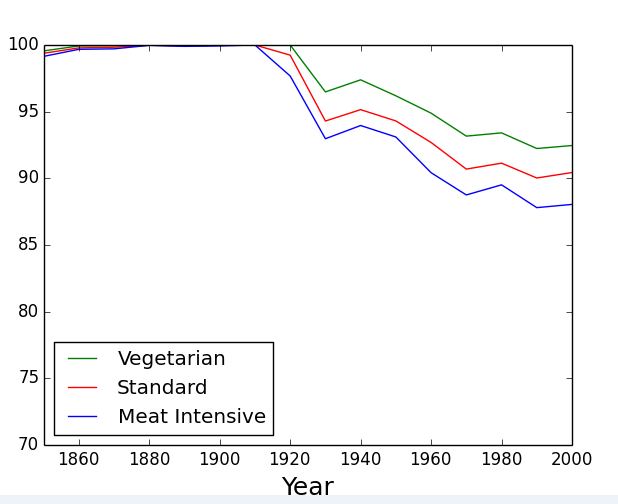
Local Food Potential Time span: 1900 - 2000 Temporal resolution: 50yr Spatial extent: United States Spatial Resolution: US Population Centers For more information please refer to this paper: The potential for local croplands to meet US food demand Publication: Zumkehr, A., & Campbell, J. E. (2015). The potential for local croplands to meet US food demand. Frontiers in Ecology and the Environment, 13(5), 244-248. http://doi.org/10.1890/140246 |
|
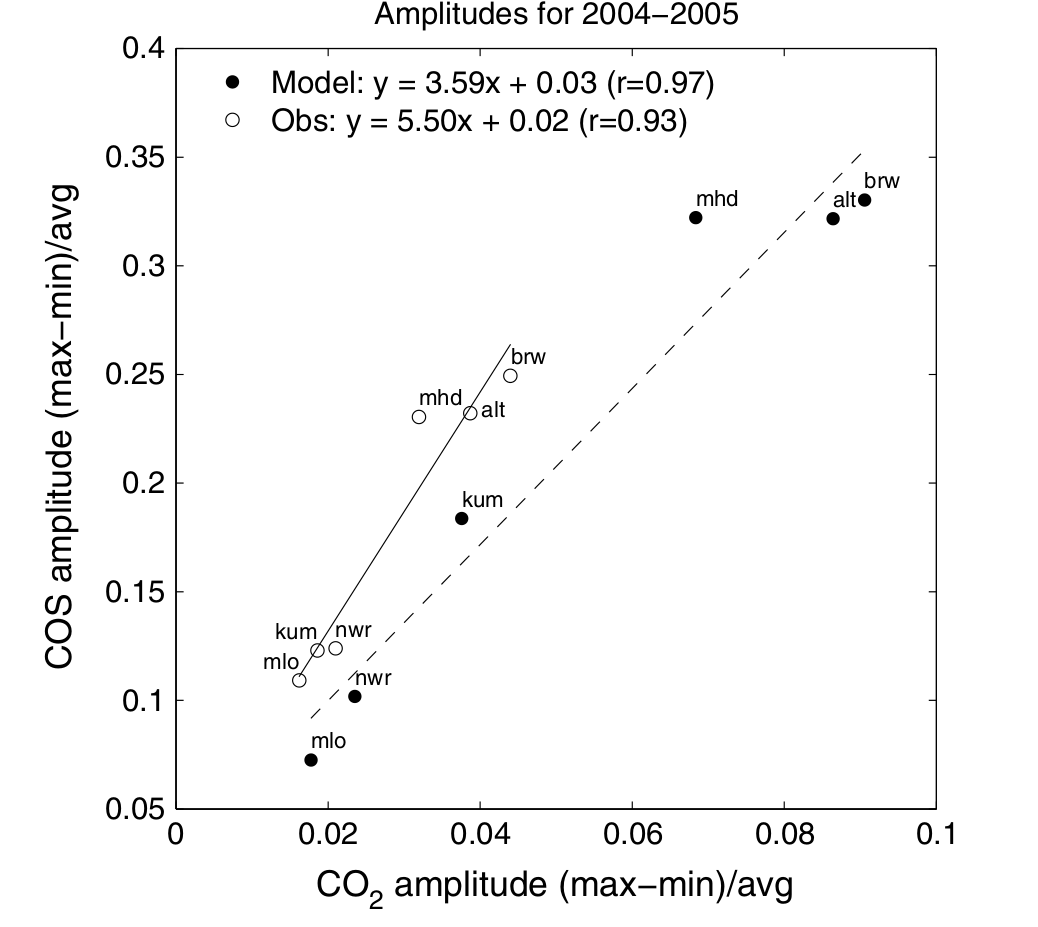
OCS Concentrations and Surface Fluxes Time span: 2003 - 2005 Temporal resolution: monthly Spatial extent: global Spatial Resolution: 1 degree by 1 degree (latitude/longitude) For more information please refer to this paper: A coupled model of the global cycles of carbonyl sulfide and CO2: A possible new window on the carbon cycle Publication: Berry, J. A.; Wolf, A.; Campbell, J. E.; Baker, I.; Blake, N.; Blake, D.; Denning, A. S.; Kawa, S. R.; Montzka, S. A.; Seibt, U.; Stimler, K.; Yakir, D.; Zhu, Z., A coupled model of the global cycles of carbonyl sulfide and CO2: A possible new window on the carbon cycle. Journal of Geophysical Research: Biogeosciences 2013, 118, 1-11. |
|
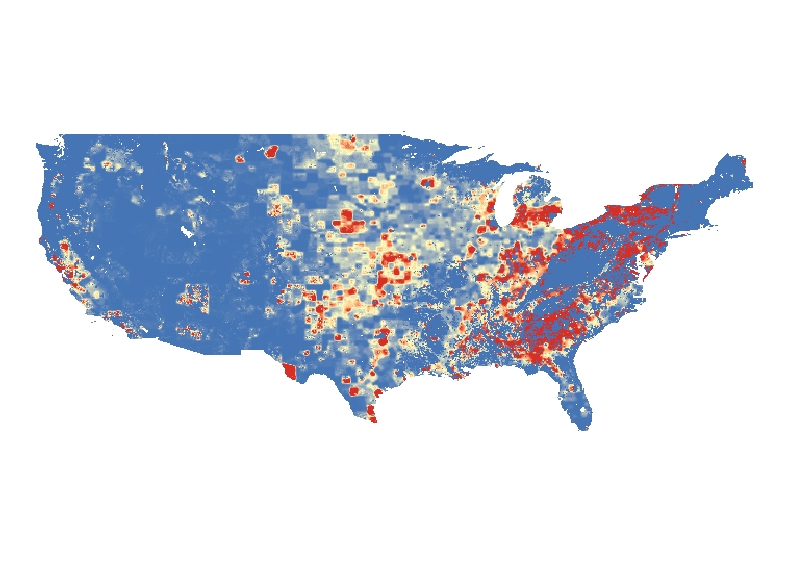
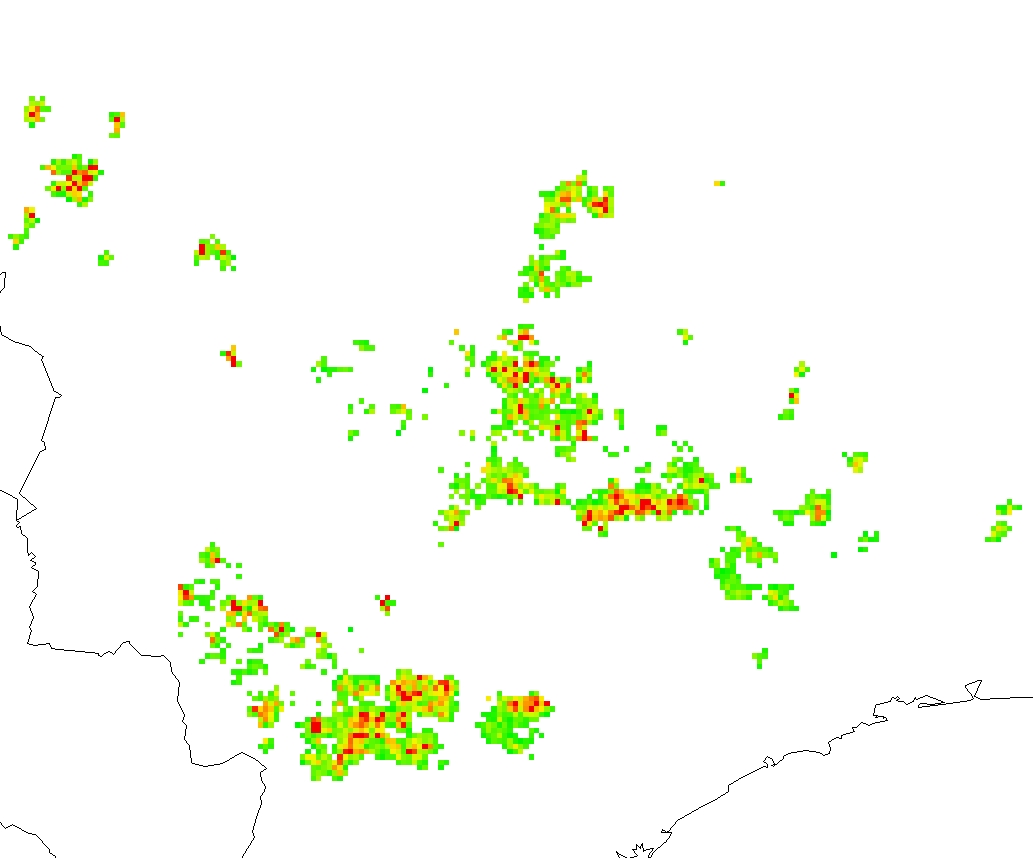
Abandoned Cropland Areas (2000) Abandoned agriculture areas created from historic fractional cropland area maps Year represented in map: 2000 Spatial extent: conterminous US Spatial Resolution: 5 min by 5 min (latitude/longitude) For more information please refer to this paper: Historical U.S. Cropland Areas and the Potential for Bioenergy Production on Abandoned Croplands Publication: Zumkehr, A., Campbell, J.E. (2013), Historical U.S. Cropland Areas and the Potential for Bioenergy Production on Abandoned Croplands, Environmental Science & Technology. |

|
Historic Fractional Cropland Areas Time span: 1850 - 2000 Temporal resolution: 1 year Spatial extent: conterminous US Spatial Resolution: 5 min by 5 min (latitude/longitude) For more information please refer to this paper: Historical U.S. Cropland Areas and the Potential for Bioenergy Production on Abandoned Croplands Publication: Zumkehr, A., Campbell, J.E. (2013), Historical U.S. Cropland Areas and the Potential for Bioenergy Production on Abandoned Croplands, Environmental Science & Technology. |
|
OCS plant uptake, CO2 GPP, and CO2 respiration fluxes over North America These NetCDF files contain OCS plant uptake flux in addition to CASA's CO2 fluxes associated with GPP and ecosystem respiration. Fluxes cover North America in the region ([22, 62]N, [63, 129]W) and are provided on a 0.5X0.5 degree grid cell. Fluxes span the period from January 1, 2004 to December 31, 2008 and are sampled every three hours. Publication: Campbell JE, Carmichael GR, et al. (2008), Photosynthetic control of atmospheric carbonyl sulfide during the growing season, Science, 322: 1085-1088. |
|
Maps of Life-cycle Emissions for Brazilian Sugarcane Ethanol This dataset contains spatially- and temporally-explicit emission maps for sugarcane ethanol life-cycle in Brazil. Baseline emission in 2008 and 2 scenarios (productions of additional one billion gallon ethanol and equivalent gasoline) within 5 life-cycle phases (farming; field burning; refinery; transportation/distribution; vehicle use) for 7 pollutants (BC; CO; NOX; PM2.5; PM10; SOX; VOC) are covered in this dataset. Full Description: Emission_Products.docx. Publication: Tsao, C. C.; Campbell, et al. (2012) Increased estimates of air-pollution emissions from Brazilian sugar-cane ethanol. Nature Climate Change, 2, (1), 53-57 |
|
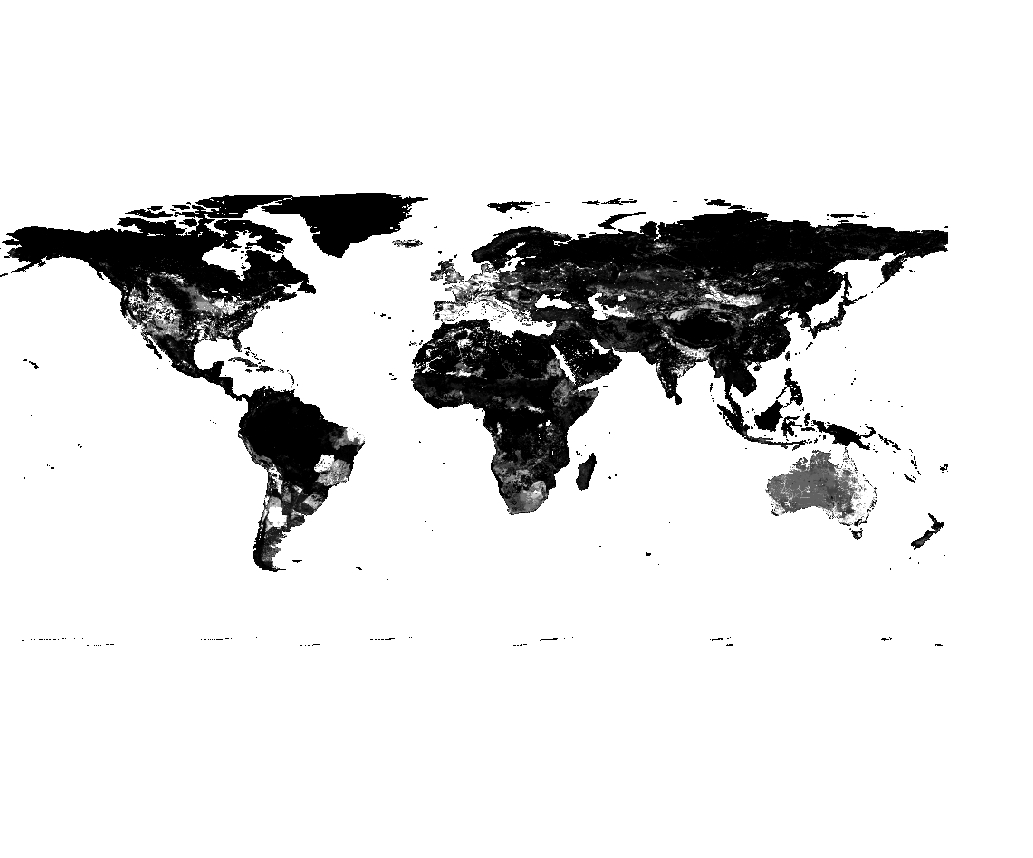
Maps of High and Low Estimates of Abandoned Agriculture Areas Converting forest lands into bioenergy agriculture could accelerate climate change by emitting carbon stored in forests, while converting food agriculture lands into bioenergy agriculture could threaten food security. Both problems are potentially avoided by using abandoned agriculture lands for bioenergy agriculture. Here we present high and low estimates of abandoned areas with a resolution of 1 km^2 grid cells using HYDE crop and pasture data and excluding MODIS forest and urban areas. For more information please refer to this paper: The Global Potential of Bioenergy on Abandoned Agriculture Lands. Publication: Campbell, J. E., D. B. Lobell, R. C. Genova, and C. B. Field (2008), The global potential of bioenergy on abandoned agriculture lands, Environmental Science & Technology, 42(15), 5791-5794. |
|
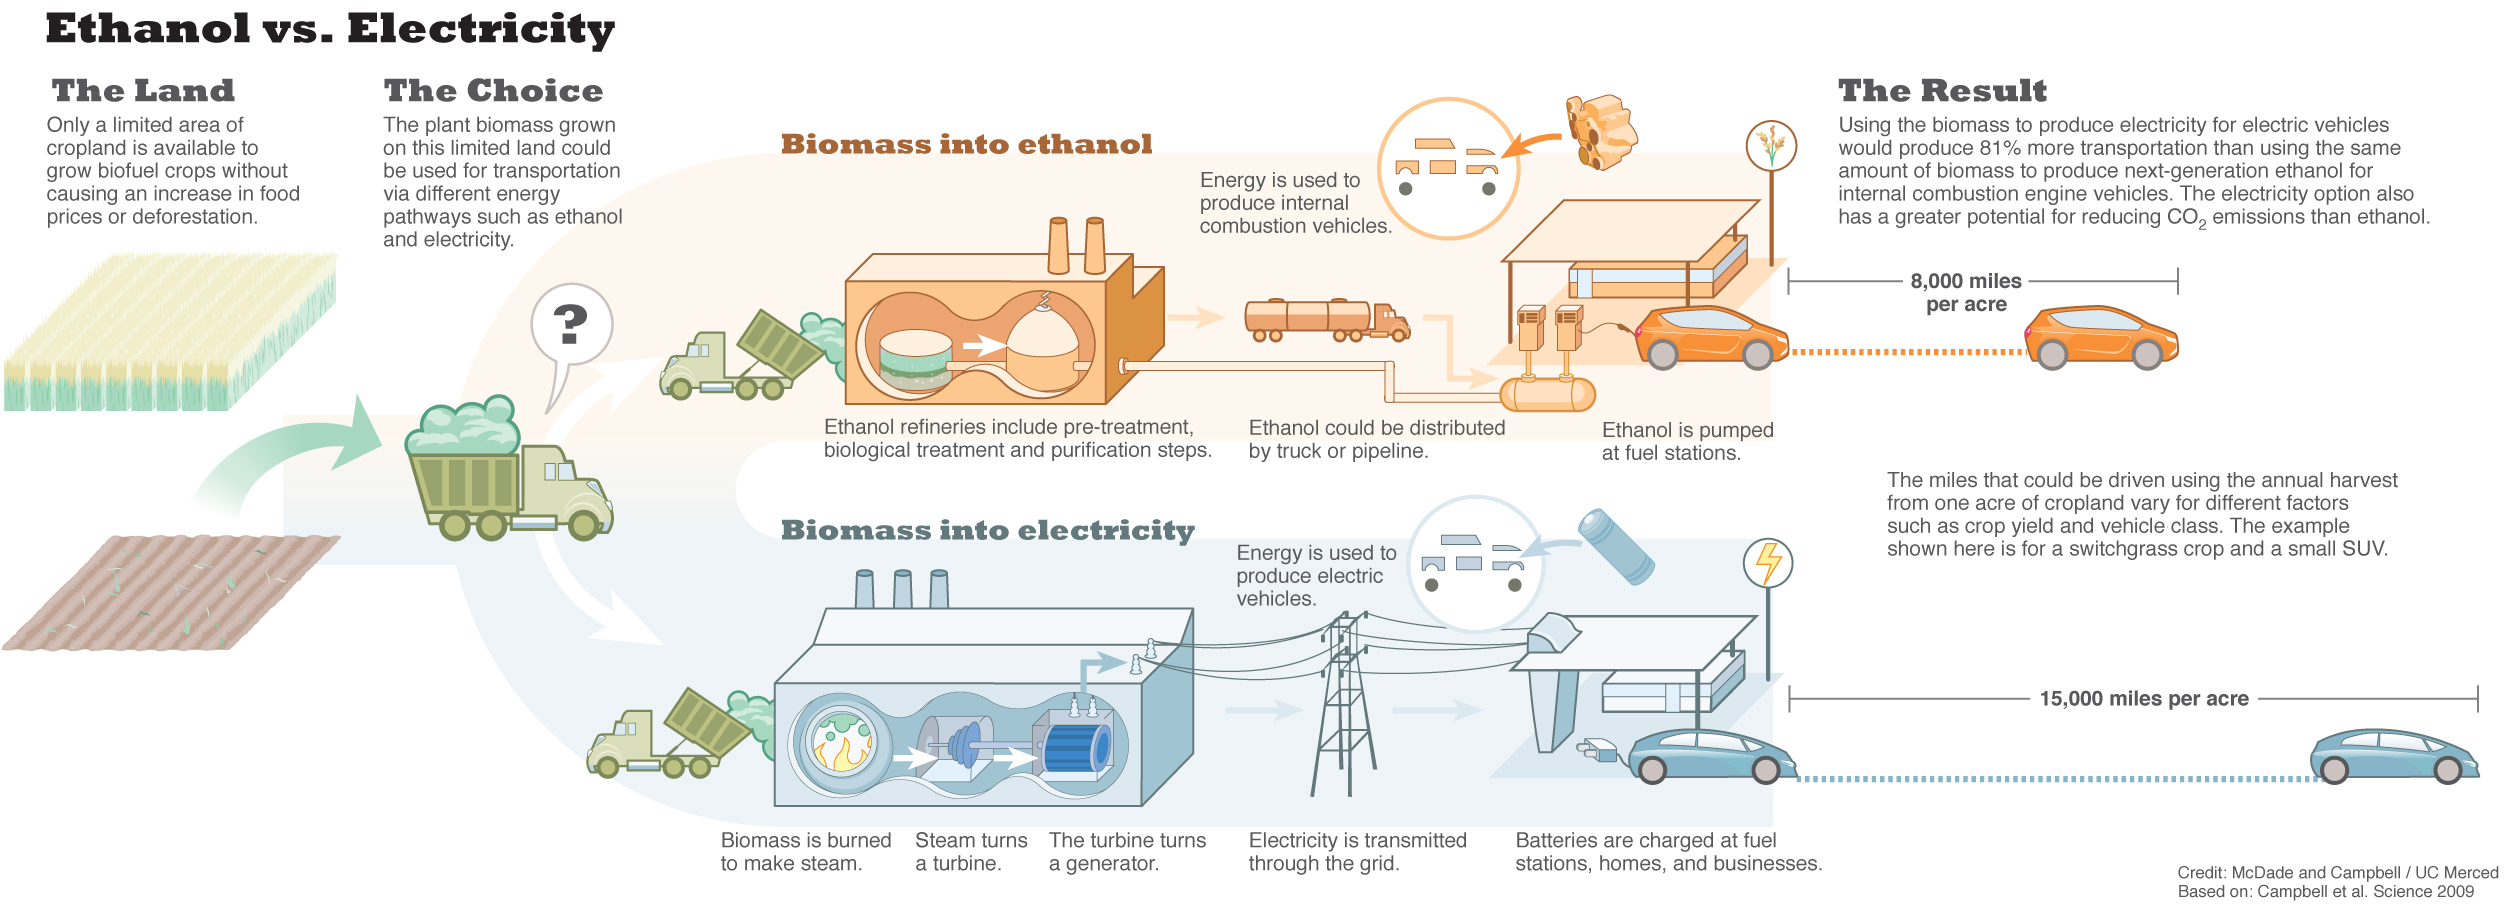
Life-cycle Assessment Model of Bioenergy Land Use Efficiency The quantity of land available to grow biofuel crops without affecting food prices or greenhouse gas (GHG) emissions from land conversion is limited. Therefore, bioenergy should maximize land-use efficiency when addressing transportation and climate change goals. Biomass could power either internal combustion or electric vehicles. Here, we show that bioelectricity outperforms ethanol across a range of feedstocks, conversion technologies, and vehicle classes. Bioelectricity produces an average of 81% more transportation kilometers and 108% more emissions offsets per unit area of cropland than does cellulosic ethanol. For more information please refer to this paper: Greater Transportation Energy and GHG Offsets from Bioelectricity Than Ethanol. Publication: Campbell JE, Lobell DB, Field CB (2009) Greater transportation energy and GHG offsets from bioelectricity than ethanol, Science, 324(5930), 1055-1057. |