The Growing Inadequacy of an open-ended Saffir-Simpson Hurricane-Wind Scale in a Warming World
Michael F. Wehner, Lawrence Berkeley National Laboratory
James P. Kossin, First Street Foundation & The University of Wisconsin-Madison
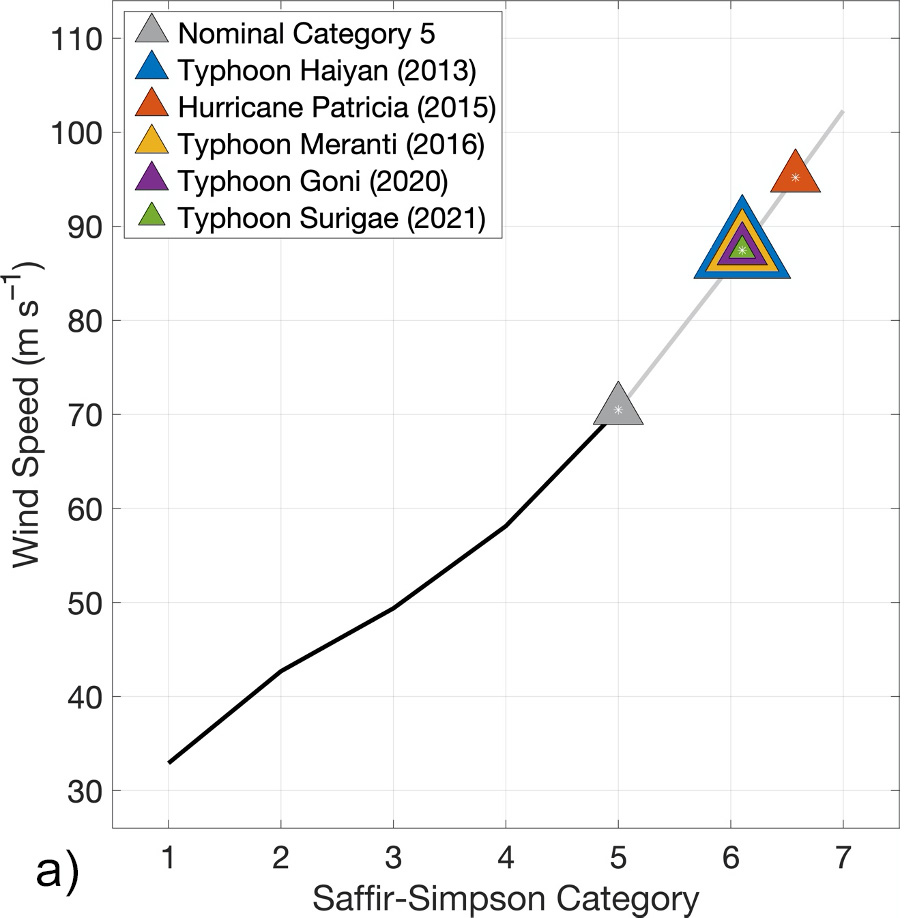
Figure 1a from our paper showing the five recent storms that reached our hypothetical category 6 wind-intensity.
This page presents data behind our PNAS paper exploring the rationale for adding a sixth category to the Saffir-Simpson Hurricane Wind Scale. See section 5 of the paper for more details of the materials and methods.
Michael F. Wehner, James P. Kossin (2023) The Growing Inadequacy of an open-ended Saffir-Simpson Hurricane-Wind Scale in a Warming World. The Proceedings of the National Academies. XXX (xx) XX-XX https://doi.org/10.1073/pnas.2308901121 https://doi.org/10.1073/pnas.2308901121
DATA DOWNLOAD INFORMATION
Section 1 Recent extreme maximum wind speeds in observed storms:
Observed tropical cyclone wind speeds are from the International Best Track Archive for Climate Stewardship (IBTrACS) and obtainable at https://www.ncdc.noaa.gov/ibtracs
Section 2 Detection, attribution and projection of changes in Potential Intensity:
MRI-AGCM3.2 results were inferred from figure 7 of Murakami et al. Future Changes in Tropical Cyclone Activity Projected by the New High-Resolution MRI-AGCM. J. Clim. 25, 3237–3260 (2012)
HiFLOR results were inferred from figure 11 of Bhatia et al. Recent increases in tropical cyclone intensification rates. Nat. Commun. 10, 1–9 (2019).
Report broken links or other problems to Michael Wehner, LBNL mfwehner@lbl.gov
MFW was supported by the Director, Office of Science, Office of Biological and Environmental Research of the U.S. Department of Energy under Contract No. DE340AC02-05CH11231 under the Regional and Global Model Analysis (RGMA) program. This document was prepared as an account of work sponsored by the United States Government. While this document is believed to contain correct information, neither the United States Government nor any agency thereof, nor the Regents of the University of California, nor any of their employees, makes any warranty, express or implied, or assumes any legal responsibility for the accuracy, completeness, or usefulness of any information, apparatus, product, or process disclosed, or represents that its use would not infringe privately owned rights. Reference herein to any specific commercial product, process, or service by its trade name, trademark, manufacturer, or otherwise, does not necessarily constitute or imply its endorsement, recommendation, or favoring by the United States Government or any agency thereof, or the Regents of the University of California. The views and opinions of authors expressed herein do not necessarily state or reflect those of the United States Government or any agency thereof or the Regents of the University of California.