| Red | Green | Blue | |
| z | 17.63 | ||
| znorm | Inf | ||
| sky | -Inf | -NaN | -Inf |
| S/N | 34.2 | 54.6 | 66.7 |
| S/N(c) | 0.0 | 0.0 | 0.0 |
| SN(E/C) |

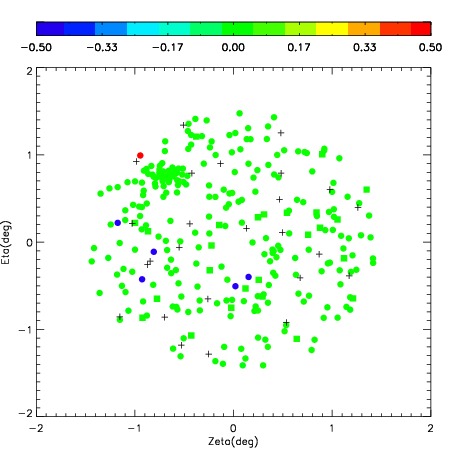
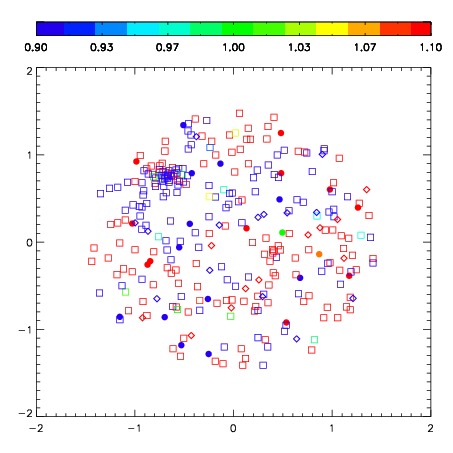
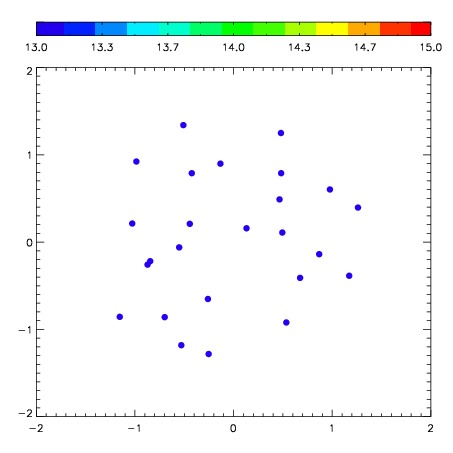

| Frame | Nreads | Zeropoints | Mag plots | Spatial mag deviation | Spatial sky 16325A emission deviations (filled: sky, open: star) | Spatial sky continuum emission | Spatial sky telluric CO2 absorption deviations (filled: H < 10) | |||||||||||||||||||||||
| 0 | 0 |
|
|
|
|
|
|
| 01970009 | 0.00000 | 266.153 |
| 01970010 | 0.00000 | 265.031 |
| 01970011 | 0.00000 | 261.678 |
| 01970012 | 0.00000 | 219.673 |
| 01970013 | 0.00000 | 207.121 |
| 01970014 | 0.00000 | 232.140 |
| 01970015 | 0.00000 | 248.428 |
| 01970016 | 0.00000 | 251.642 |
| 01970017 | 0.00000 | 245.163 |