| Red | Green | Blue | |
| z | 17.64 | ||
| znorm | Inf | ||
| sky | -NaN | -NaN | -Inf |
| S/N | 46.8 | 75.0 | 93.8 |
| S/N(c) | 0.0 | 0.0 | 0.0 |
| SN(E/C) |

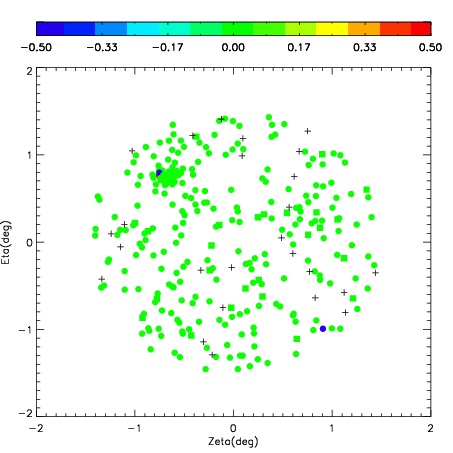
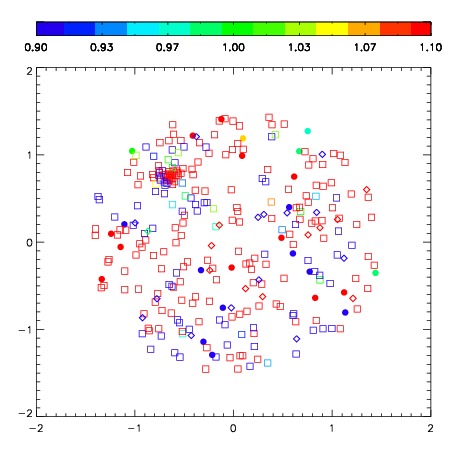
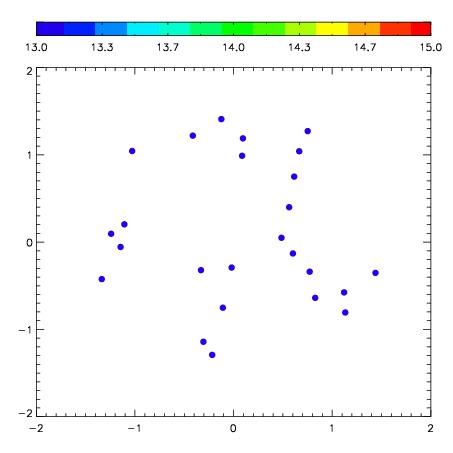
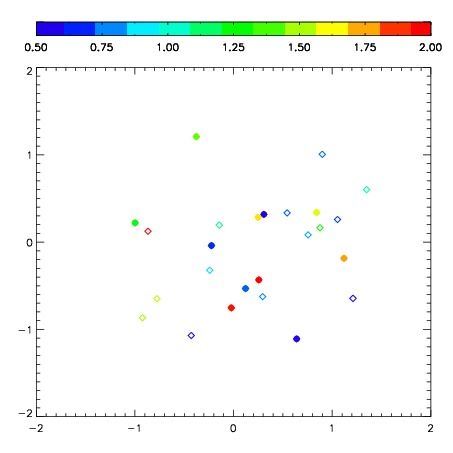
| Frame | Nreads | Zeropoints | Mag plots | Spatial mag deviation | Spatial sky 16325A emission deviations (filled: sky, open: star) | Spatial sky continuum emission | Spatial sky telluric CO2 absorption deviations (filled: H < 10) | |||||||||||||||||||||||
| 0 | 0 |
|
|
|
|
|
|
| 01600067 | 0.00000 | 249.391 |
| 01600068 | 0.00000 | 250.765 |
| 01600069 | 0.00000 | 252.209 |
| 01600070 | 0.00000 | 255.634 |
| 01600071 | 0.00000 | 257.458 |
| 01600072 | 0.00000 | 256.159 |
| 01600073 | 0.00000 | 255.641 |
| 01600074 | 0.00000 | 255.145 |
| 01600075 | 0.00000 | 253.223 |
| 01600076 | 0.00000 | 251.377 |
| 01600077 | 0.00000 | 253.423 |