| Red | Green | Blue | |
| z | 17.64 | ||
| znorm | Inf | ||
| sky | -NaN | -Inf | -Inf |
| S/N | 44.7 | 70.5 | 84.1 |
| S/N(c) | 0.0 | 0.0 | 0.0 |
| SN(E/C) |

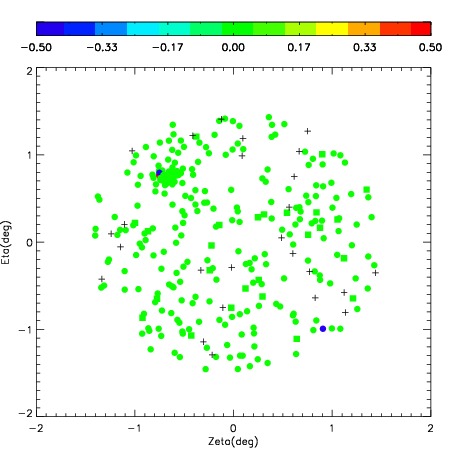
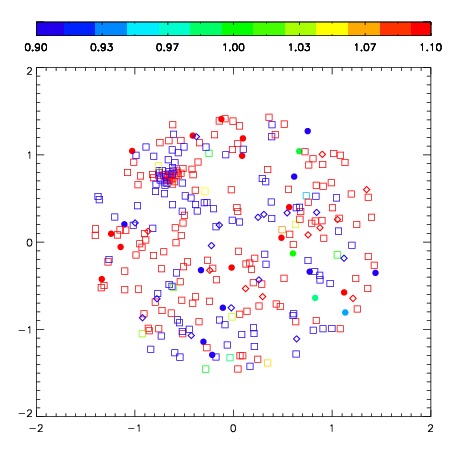
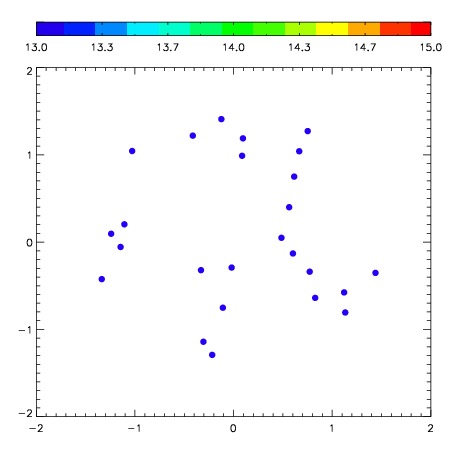

| Frame | Nreads | Zeropoints | Mag plots | Spatial mag deviation | Spatial sky 16325A emission deviations (filled: sky, open: star) | Spatial sky continuum emission | Spatial sky telluric CO2 absorption deviations (filled: H < 10) | |||||||||||||||||||||||
| 0 | 0 |
|
|
|
|
|
|
| 01610018 | 0.00000 | 236.393 |
| 01610019 | 0.00000 | 246.855 |
| 01610020 | 0.00000 | 251.208 |
| 01610021 | 0.00000 | 254.145 |
| 01610022 | 0.00000 | 253.841 |
| 01610023 | 0.00000 | 249.620 |
| 01610024 | 0.00000 | 252.324 |
| 01610025 | 0.00000 | 249.341 |
| 01610026 | 0.00000 | 251.188 |
| 01610027 | 0.00000 | 252.432 |