| Red | Green | Blue | |
| z | 17.64 | ||
| znorm | Inf | ||
| sky | -Inf | -Inf | -Inf |
| S/N | 59.6 | 90.3 | 106.5 |
| S/N(c) | 59.6 | 90.3 | 106.5 |
| SN(E/C) |

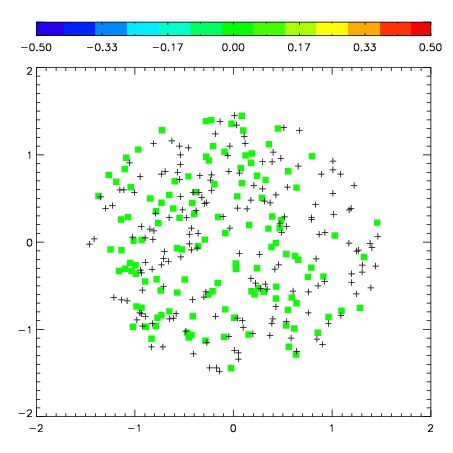
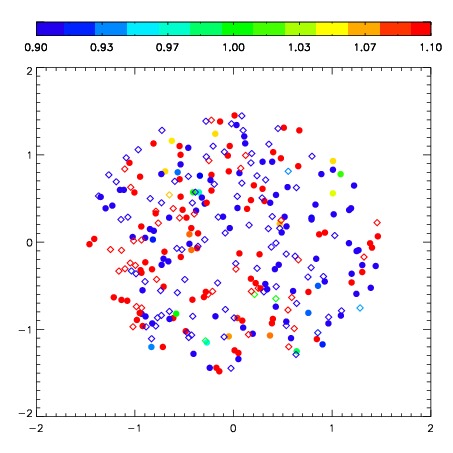
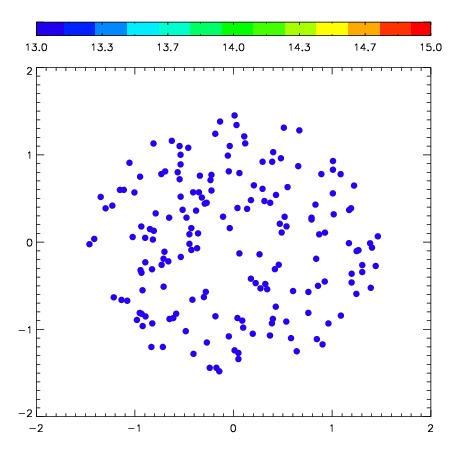
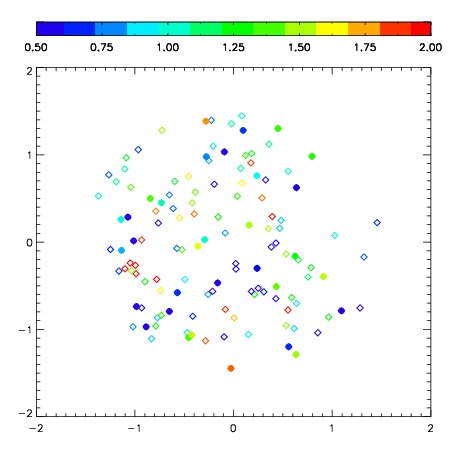
| Frame | Nreads | Zeropoints | Mag plots | Spatial mag deviation | Spatial sky 16325A emission deviations (filled: sky, open: star) | Spatial sky continuum emission | Spatial sky telluric CO2 absorption deviations (filled: H < 10) | |||||||||||||||||||||||
| 0 | 0 |
|
|
|
|
|
|
| 01620034 | 0.00000 | 264.464 |
| 01620035 | 0.00000 | 273.934 |
| 01620036 | 0.00000 | 276.159 |
| 01620037 | 0.00000 | 273.164 |
| 01620038 | 0.00000 | 281.849 |
| 01620039 | 0.00000 | 283.019 |
| 01620040 | 0.00000 | 280.926 |
| 01620041 | 0.00000 | 282.639 |
| 01620042 | 0.00000 | 287.559 |
| 01620043 | 0.00000 | 287.220 |
| 01620044 | 0.00000 | 291.551 |
| 01620045 | 0.00000 | 290.921 |