| Frame | Nreads | Zeropoints | Mag plots
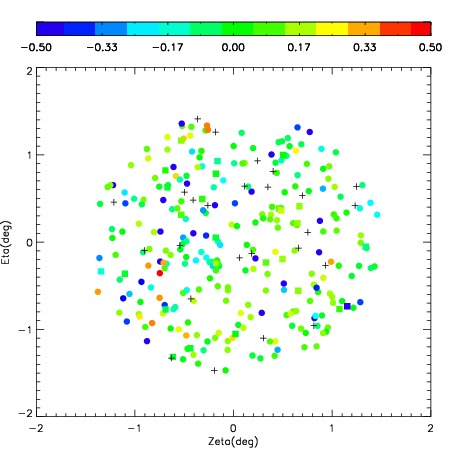
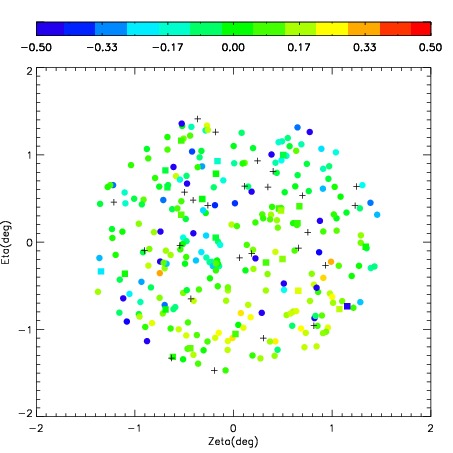
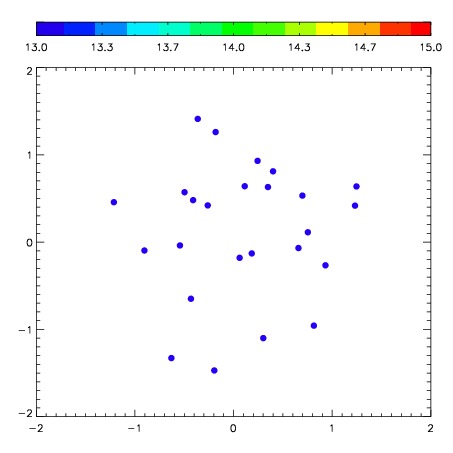
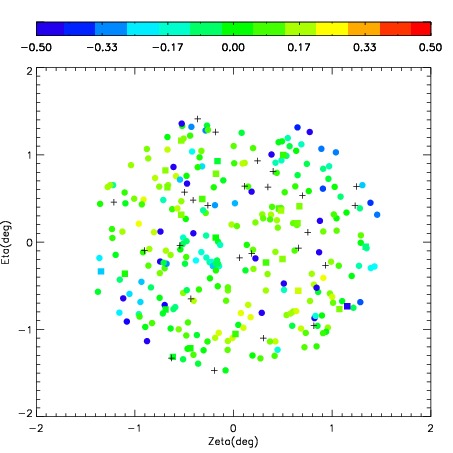
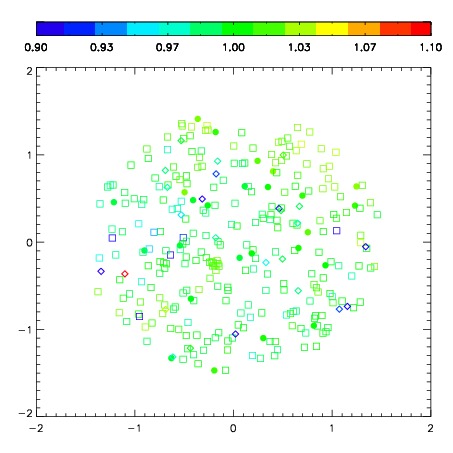
| Spatial mag deviation
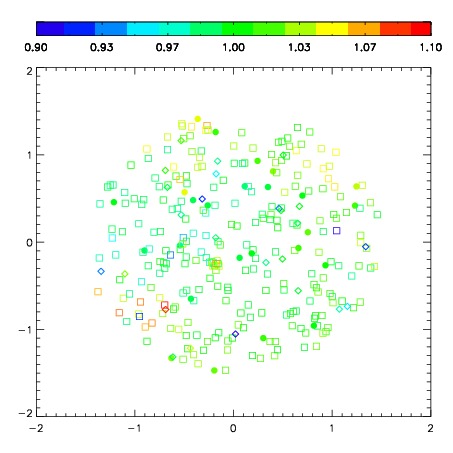
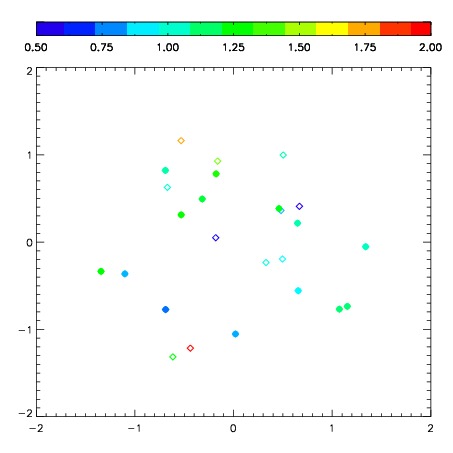
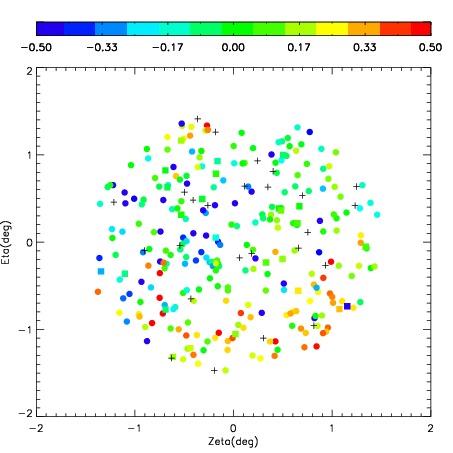
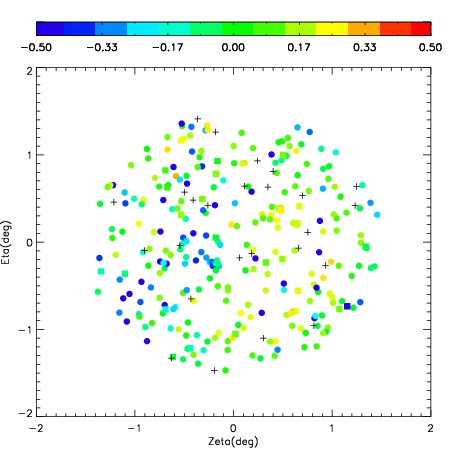
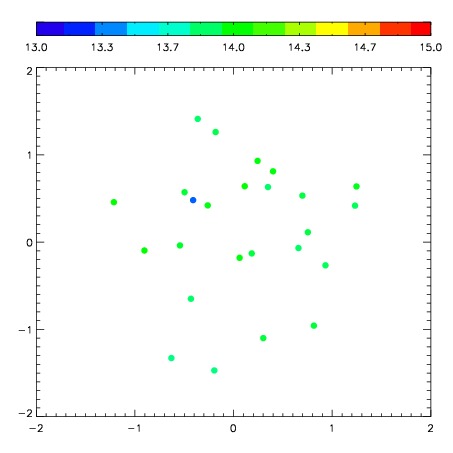
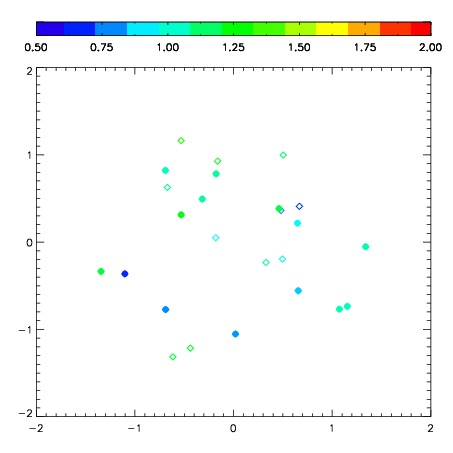
| Spatial sky 16325A emission deviations (filled: sky, open: star)
| Spatial sky continuum emission
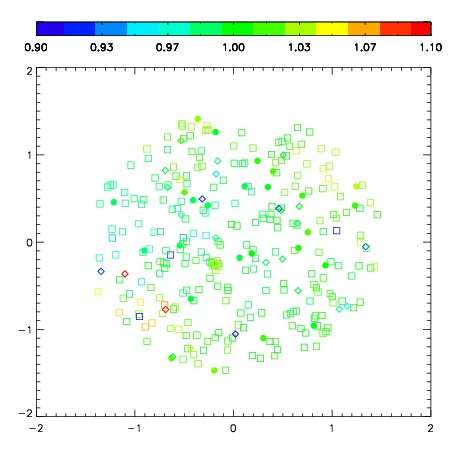
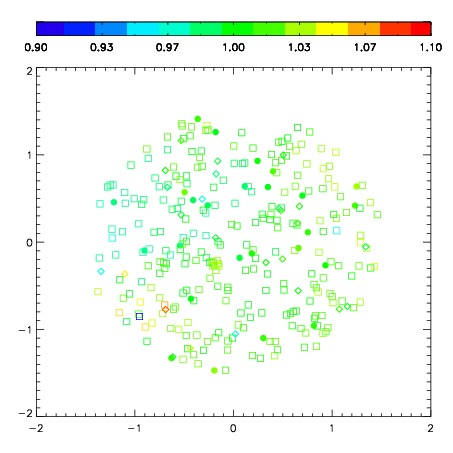
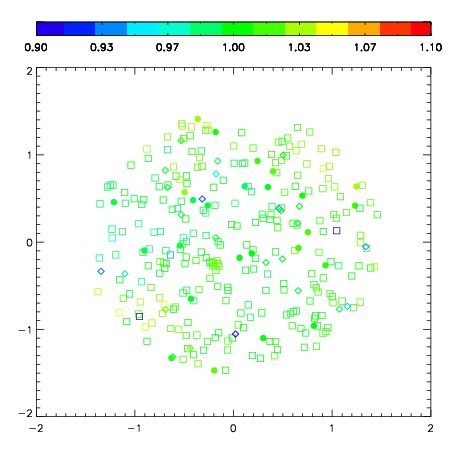
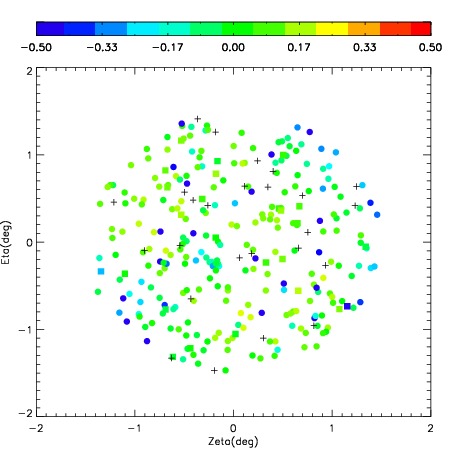
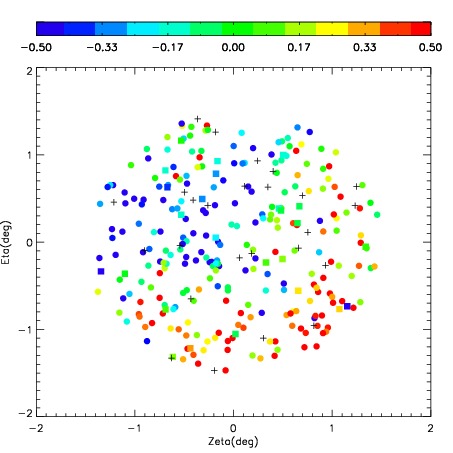
| Spatial sky telluric CO2 absorption deviations (filled: H < 10)
|
| 1640033
| 50
| | Red | Green | Blue
| | z | | 18.35
| | znorm | | 14.10
| | sky | 13.2 | 12.9 | 13.2
| | S/N | 8.2 | 13.4 | 16.9
| | S/N(c) | 7.2 | 12.7 | 15.8
| | SN(E/C) 0.37
|
| 
| 
| 
| 
| 
|
| 1640034
| 50
| | Red | Green | Blue
| | z | | 18.31
| | znorm | | 14.06
| | sky | 13.1 | 12.9 | 13.0
| | S/N | 7.9 | 12.7 | 16.0
| | S/N(c) | 6.8 | 11.9 | 14.6
| | SN(E/C) 0.38
|
| 
| 
| 
| 
| 
|
| 1640035
| 50
| | Red | Green | Blue
| | z | | 16.70
| | znorm | | 12.45
| | sky | 12.6 | 12.5 | 12.5
| | S/N | 1.8 | 3.1 | 4.2
| | S/N(c) | 1.6 | 3.0 | 3.6
| | SN(E/C) 0.66
|
| 
| 
| 
| 
| 
|
| 1640036
| 50
| | Red | Green | Blue
| | z | | 17.84
| | znorm | | 13.59
| | sky | 13.0 | 12.8 | 12.9
| | S/N | 5.2 | 8.9 | 11.6
| | S/N(c) | 4.7 | 8.4 | 10.7
| | SN(E/C) 0.43
|
| 
| 
| 
| 
| 
|
| 1640037
| 50
| | Red | Green | Blue
| | z | | 19.00
| | znorm | | 14.75
| | sky | 14.0 | 13.9 | 14.0
| | S/N | 14.4 | 22.3 | 27.9
| | S/N(c) | 12.7 | 21.0 | 26.4
| | SN(E/C) 0.27
|
| 
| 
| 
| 
| 
|
| 1640038
| 50
| | Red | Green | Blue
| | z | | 18.88
| | znorm | | 14.64
| | sky | 13.7 | 13.6 | 13.7
| | S/N | 13.1 | 20.6 | 25.3
| | S/N(c) | 11.7 | 18.9 | 23.4
| | SN(E/C) 0.29
|
| 
| 
| 
| 
| 
|
| 1640039
| 50
| | Red | Green | Blue
| | z | | 15.25
| | znorm | | 11.00
| | sky | 12.4 | 12.4 | 12.4
| | S/N | 0.4 | 0.8 | 1.3
| | S/N(c) | 0.4 | 0.8 | 1.0
| | SN(E/C) 0.86
|
| 
| 
| 
| 
| 
|