| Frame | Nreads | Zeropoints | Mag plots
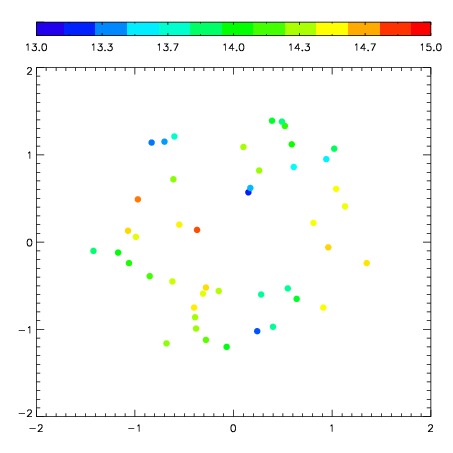
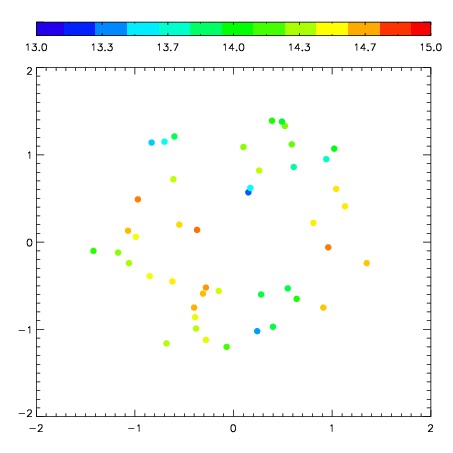
| Spatial mag deviation
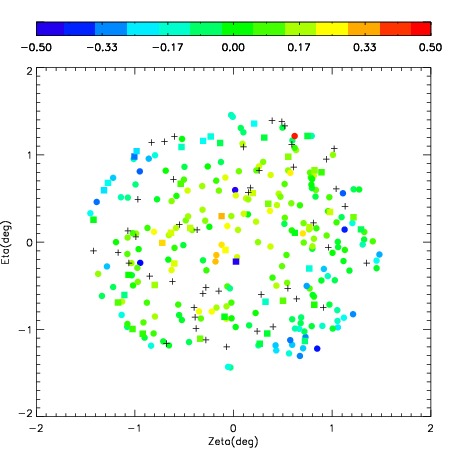
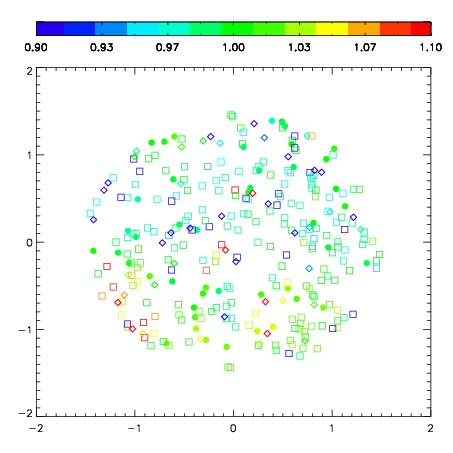
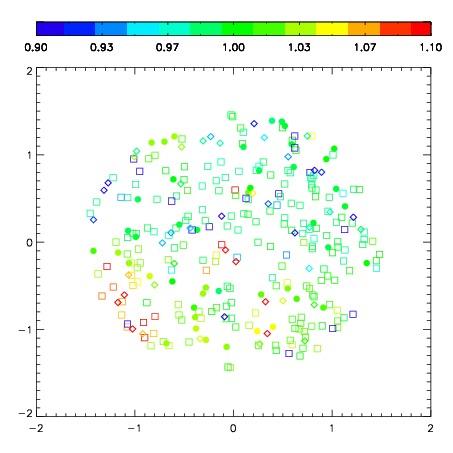
| Spatial sky 16325A emission deviations (filled: sky, open: star)
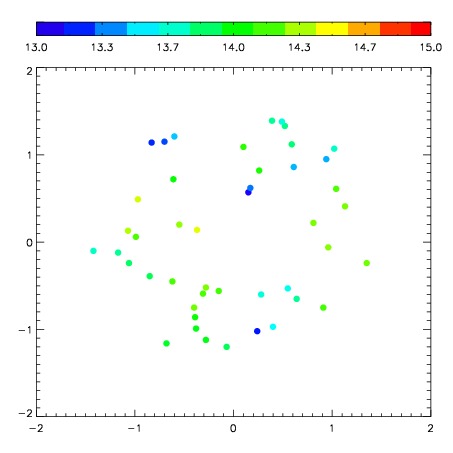
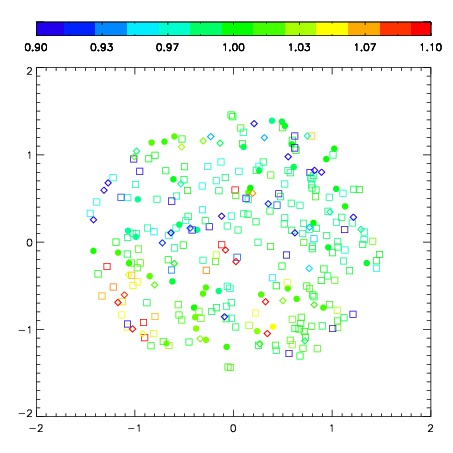
| Spatial sky continuum emission
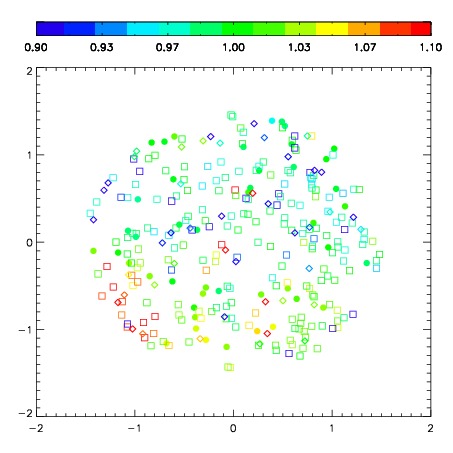
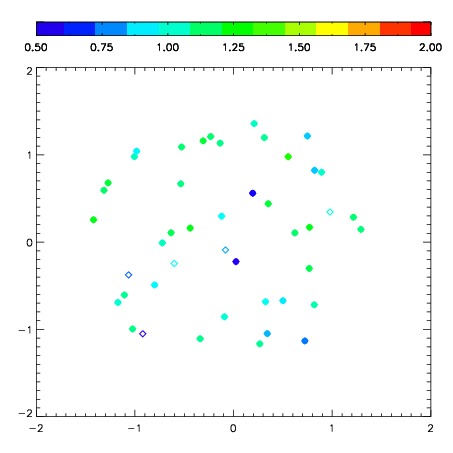
| Spatial sky telluric CO2 absorption deviations (filled: H < 10)
|
| 1900084
| 50
| | Red | Green | Blue
| | z | | 18.88
| | znorm | | 14.63
| | sky | 14.6 | 13.9 | 13.7
| | S/N | 14.4 | 20.1 | 24.0
| | S/N(c) | 12.5 | 19.7 | 23.9
| | SN(E/C) 0.36
|
| 
| 
| 
| 
| 
|
| 1900085
| 50
| | Red | Green | Blue
| | z | | 18.90
| | znorm | | 14.66
| | sky | 14.4 | 14.1 | 14.0
| | S/N | 14.6 | 20.0 | 23.3
| | S/N(c) | 12.6 | 19.4 | 23.3
| | SN(E/C) 0.36
|
| 
| 
| 
| 
| 
|
| 1900086
| 50
| | Red | Green | Blue
| | z | | 18.94
| | znorm | | 14.70
| | sky | 14.6 | 14.2 | 14.0
| | S/N | 14.7 | 20.8 | 23.2
| | S/N(c) | 12.9 | 20.2 | 23.2
| | SN(E/C) 0.34
|
| 
| 
| 
| 
| 
|
| 1900087
| 50
| | Red | Green | Blue
| | z | | 18.92
| | znorm | | 14.67
| | sky | 14.4 | 14.2 | 14.1
| | S/N | 14.2 | 20.6 | 23.1
| | S/N(c) | 12.6 | 19.4 | 22.5
| | SN(E/C) 0.36
|
| 
| 
| 
| 
| 
|
| 1900088
| 50
| | Red | Green | Blue
| | z | | 18.83
| | znorm | | 14.58
| | sky | 14.7 | 14.3 | 14.1
| | S/N | 13.5 | 19.8 | 21.6
| | S/N(c) | 11.5 | 18.6 | 21.5
| | SN(E/C) 0.34
|
| 
| 
| 
| 
| 
|
| 1900089
| 50
| | Red | Green | Blue
| | z | | 18.82
| | znorm | | 14.57
| | sky | 14.4 | 14.3 | 14.1
| | S/N | 13.0 | 19.8 | 21.9
| | S/N(c) | 11.3 | 18.2 | 21.3
| | SN(E/C) 0.38
|
| 
| 
| 
| 
| 
|
| 1900090
| 50
| | Red | Green | Blue
| | z | | 18.75
| | znorm | | 14.50
| | sky | 14.3 | 14.3 | 14.2
| | S/N | 12.6 | 19.4 | 21.2
| | S/N(c) | 10.9 | 17.8 | 20.6
| | SN(E/C) 0.37
|
| 
| 
| 
| 
| 
|