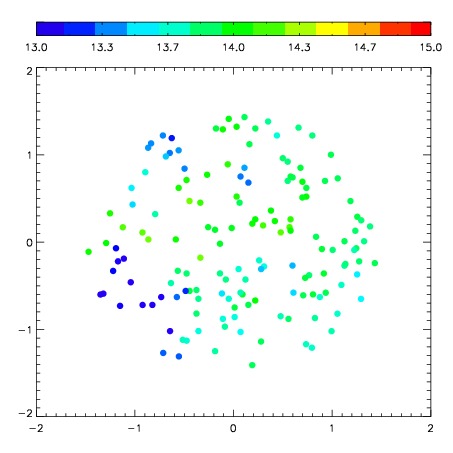
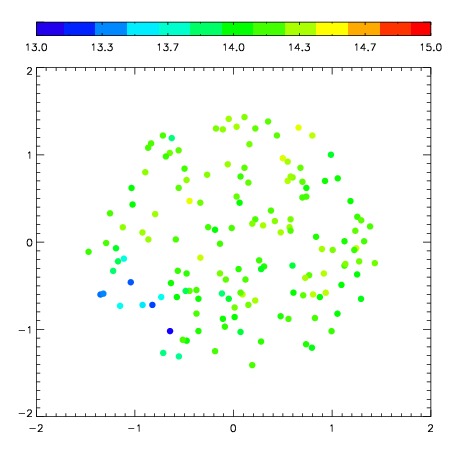
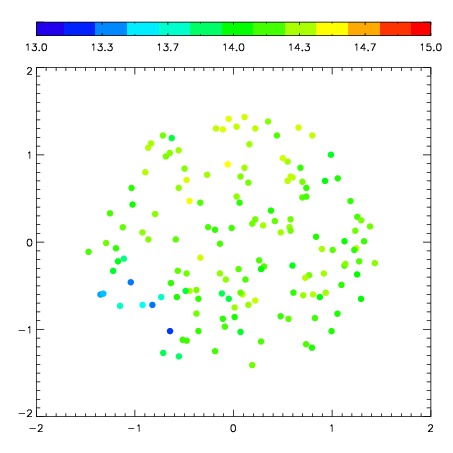
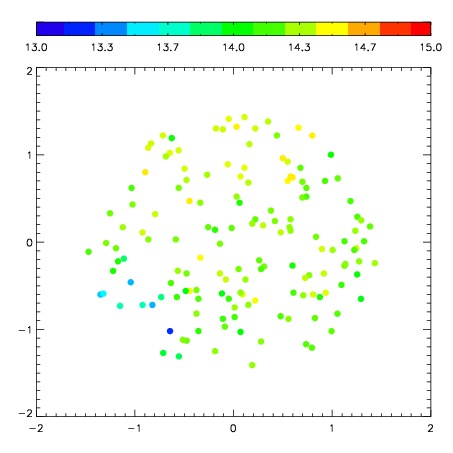
| Frame | Nreads | Zeropoints | Mag plots
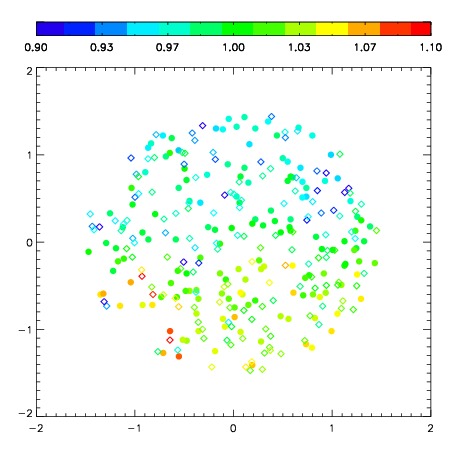
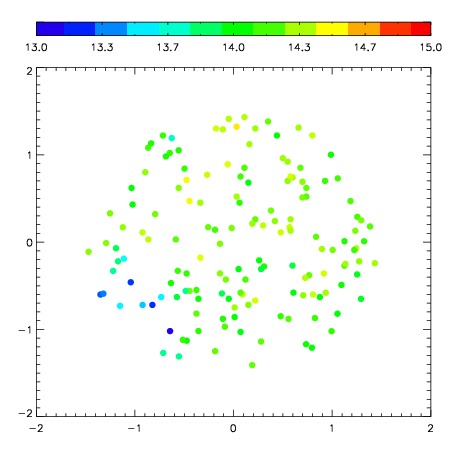
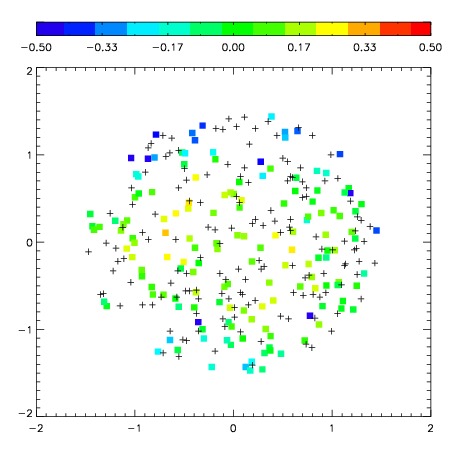
| Spatial mag deviation
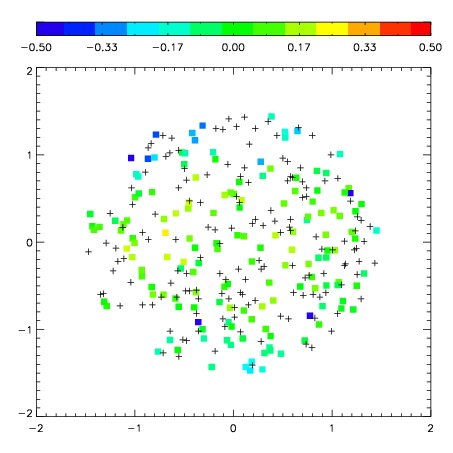
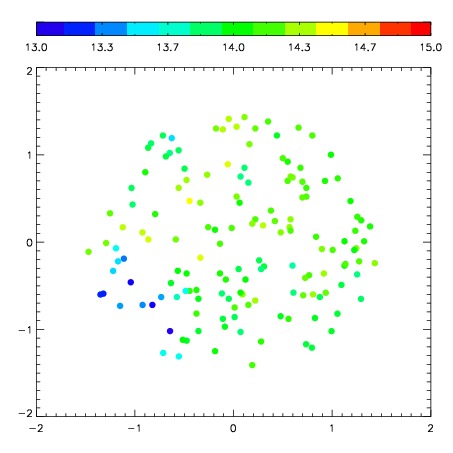
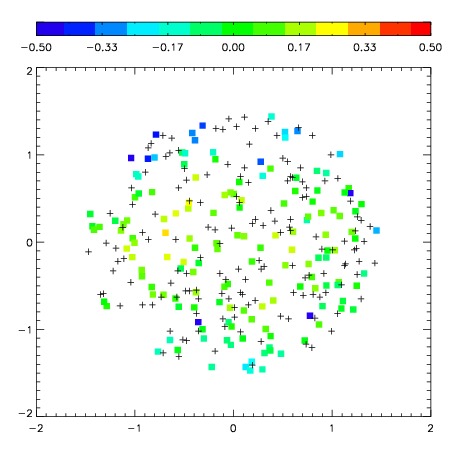
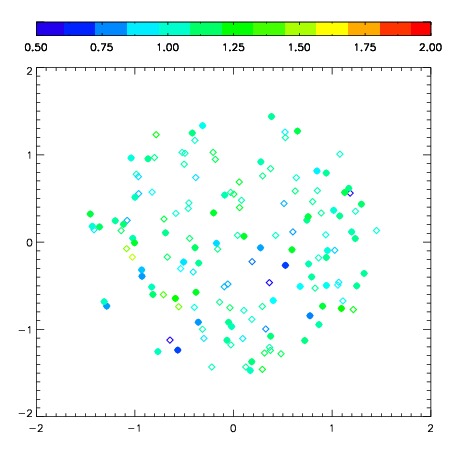
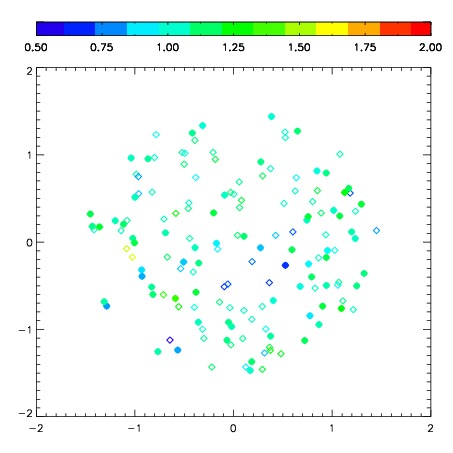
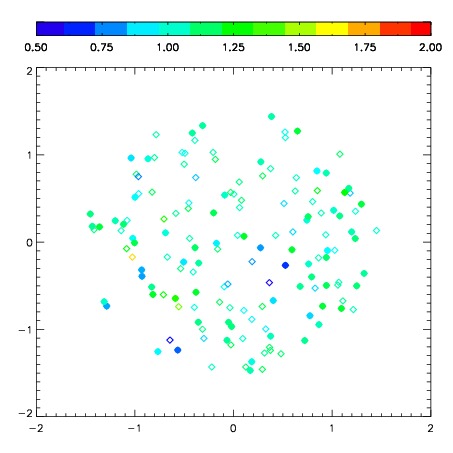
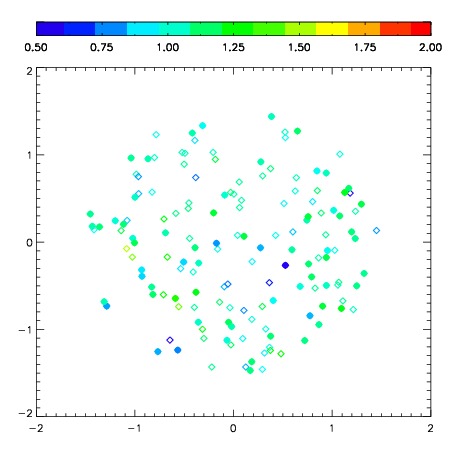
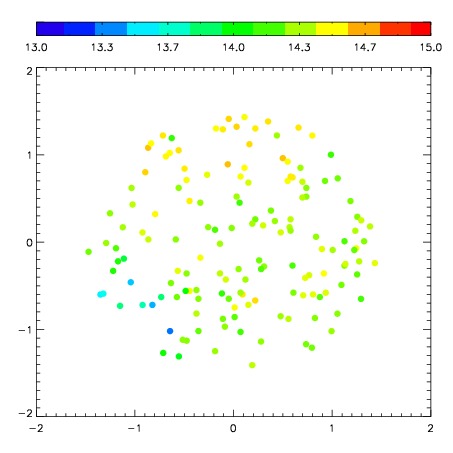
| Spatial sky 16325A emission deviations (filled: sky, open: star)
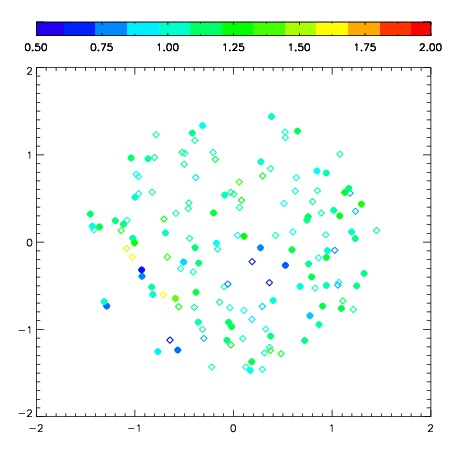
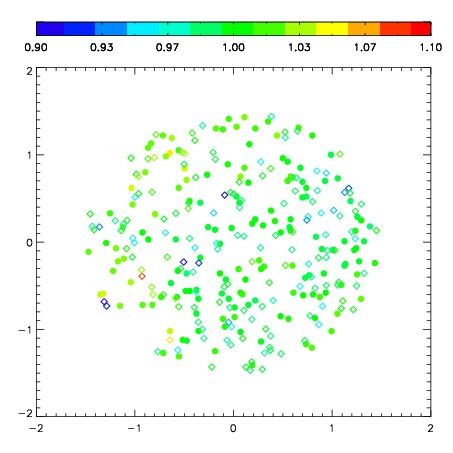
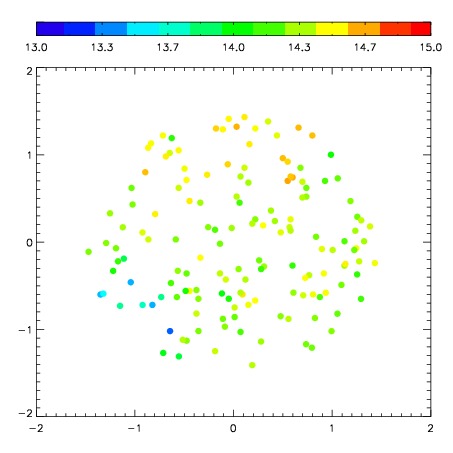
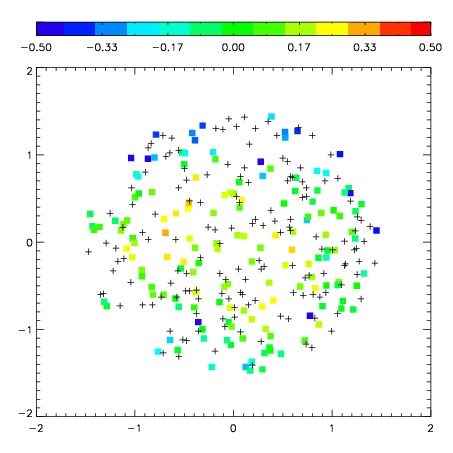
| Spatial sky continuum emission
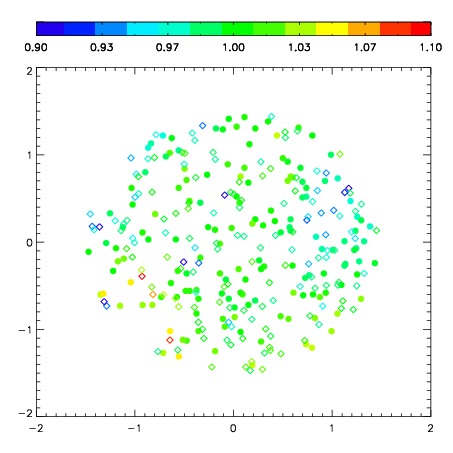
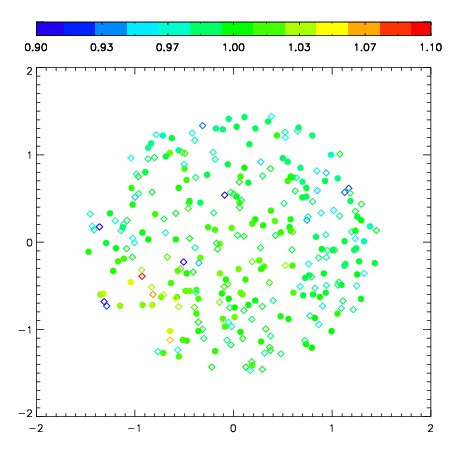
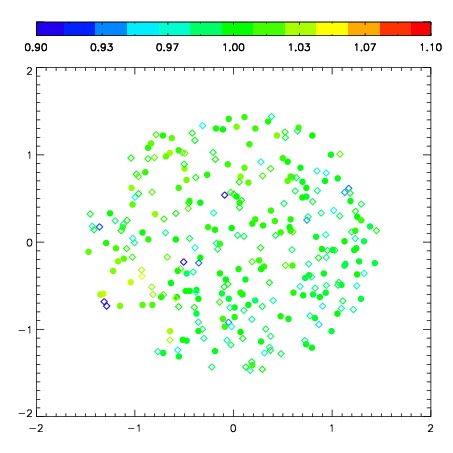
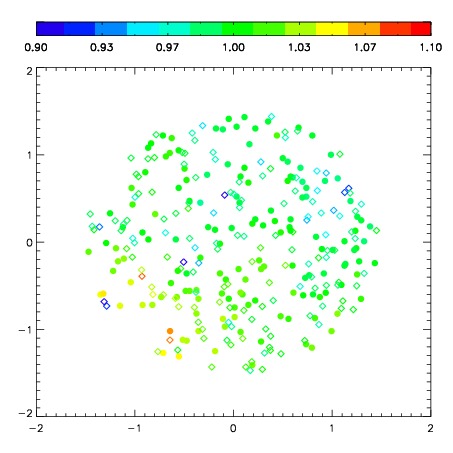
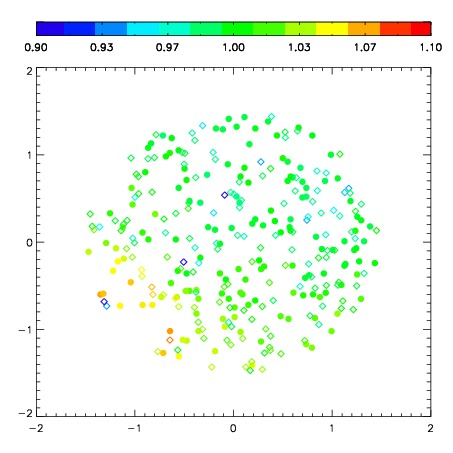
| Spatial sky telluric CO2 absorption deviations (filled: H < 10)
|
| 1630075
| 50
| | Red | Green | Blue
| | z | | 19.01
| | znorm | | 14.76
| | sky | 14.4 | 13.8 | 14.2
| | S/N | 18.6 | 26.8 | 31.3
| | S/N(c) | 17.1 | 26.1 | 30.4
| | SN(E/C) 0.89
|
| 
| 
| 
| 
| 
|
| 1630076
| 50
| | Red | Green | Blue
| | z | | 18.93
| | znorm | | 14.69
| | sky | 14.4 | 14.0 | 14.4
| | S/N | 17.8 | 25.9 | 30.0
| | S/N(c) | 16.3 | 25.3 | 29.3
| | SN(E/C) 0.91
|
| 
| 
| 
| 
| 
|
| 1630077
| 50
| | Red | Green | Blue
| | z | | 18.95
| | znorm | | 14.70
| | sky | 14.7 | 14.1 | 14.4
| | S/N | 18.0 | 26.2 | 30.6
| | S/N(c) | 16.3 | 25.4 | 29.7
| | SN(E/C) 0.90
|
| 
| 
| 
| 
| 
|
| 1630078
| 50
| | Red | Green | Blue
| | z | | 18.92
| | znorm | | 14.67
| | sky | 14.4 | 14.1 | 14.4
| | S/N | 17.9 | 25.4 | 30.3
| | S/N(c) | 16.2 | 24.5 | 29.5
| | SN(E/C) 0.90
|
| 
| 
| 
| 
| 
|
| 1630079
| 50
| | Red | Green | Blue
| | z | | 18.97
| | znorm | | 14.72
| | sky | 14.5 | 14.1 | 14.4
| | S/N | 18.3 | 26.3 | 31.1
| | S/N(c) | 16.7 | 25.4 | 30.0
| | SN(E/C) 0.90
|
| 
| 
| 
| 
| 
|
| 1630080
| 50
| | Red | Green | Blue
| | z | | 18.93
| | znorm | | 14.69
| | sky | 14.4 | 14.3 | 14.4
| | S/N | 18.1 | 26.0 | 30.7
| | S/N(c) | 16.5 | 25.1 | 29.5
| | SN(E/C) 0.89
|
| 
| 
| 
| 
| 
|
| 1630081
| 50
| | Red | Green | Blue
| | z | | 18.89
| | znorm | | 14.64
| | sky | 14.5 | 14.2 | 14.3
| | S/N | 17.8 | 25.7 | 30.0
| | S/N(c) | 16.1 | 24.7 | 28.8
| | SN(E/C) 0.90
|
| 
| 
| 
| 
| 
|
| 1630082
| 50
| | Red | Green | Blue
| | z | | 18.87
| | znorm | | 14.62
| | sky | 14.4 | 14.3 | 14.3
| | S/N | 17.6 | 25.8 | 29.5
| | S/N(c) | 16.0 | 24.8 | 28.3
| | SN(E/C) 0.91
|
| 
| 
| 
| 
| 
|