| Red | Green | Blue | |
| z | 17.64 | ||
| znorm | Inf | ||
| sky | -NaN | -NaN | -Inf |
| S/N | 19.3 | 28.3 | 31.4 |
| S/N(c) | 19.3 | 28.3 | 31.4 |
| SN(E/C) |

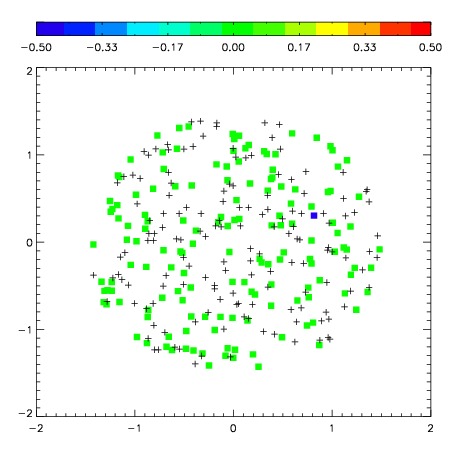
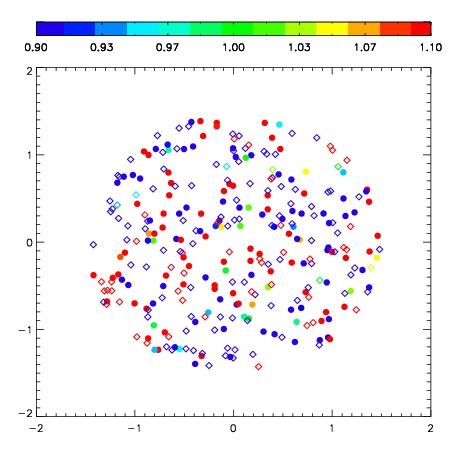
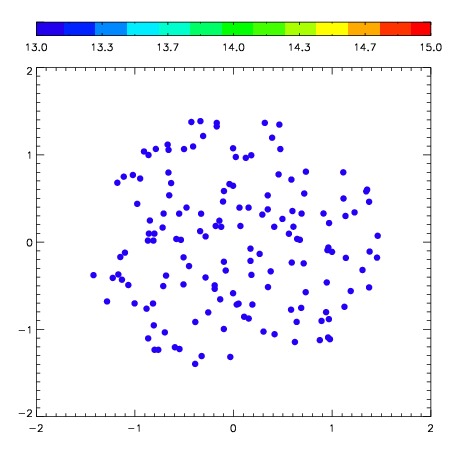
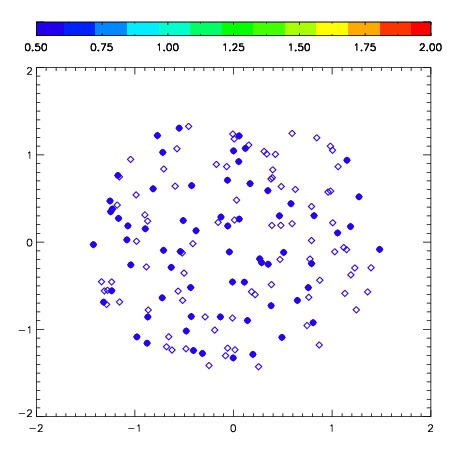
| Frame | Nreads | Zeropoints | Mag plots | Spatial mag deviation | Spatial sky 16325A emission deviations (filled: sky, open: star) | Spatial sky continuum emission | Spatial sky telluric CO2 absorption deviations (filled: H < 10) | |||||||||||||||||||||||
| 0 | 0 |
|
|
|
|
|
|
| IPAIR | NAME | SHIFT | NEWSHIFT | S/N | NAME | SHIFT | NEWSHIFT | S/N |
| 0 | 02450034 | 0.312043 | 0.00000 | 206.404 | 02450036 | 0.00428370 | 0.307759 | 193.829 |
| 1 | 02450035 | 0.306003 | 0.00604001 | 209.660 | 02450033 | 0.00000 | 0.312043 | 196.403 |