| Frame | Nreads | Zeropoints | Mag plots
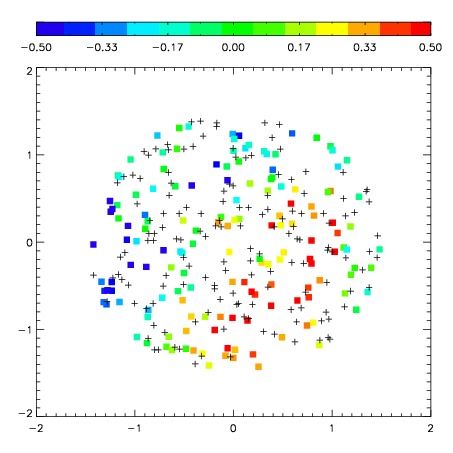
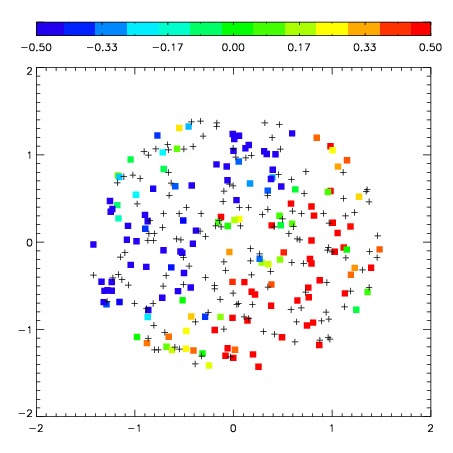
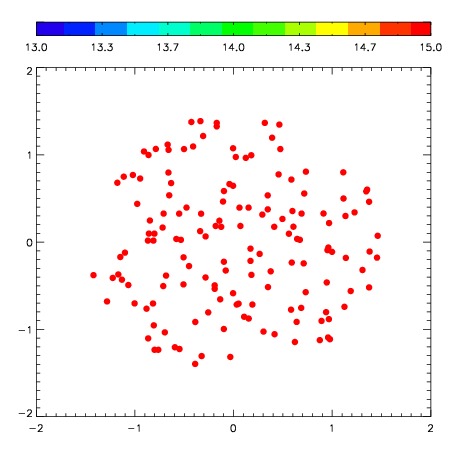
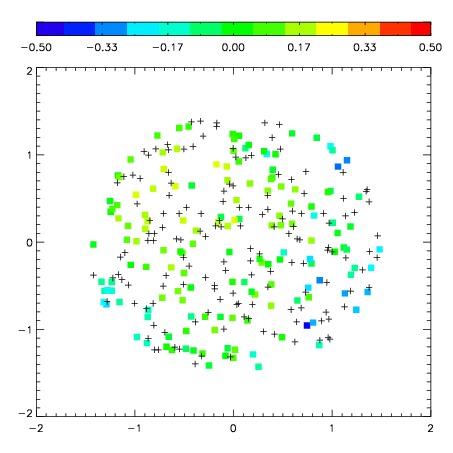
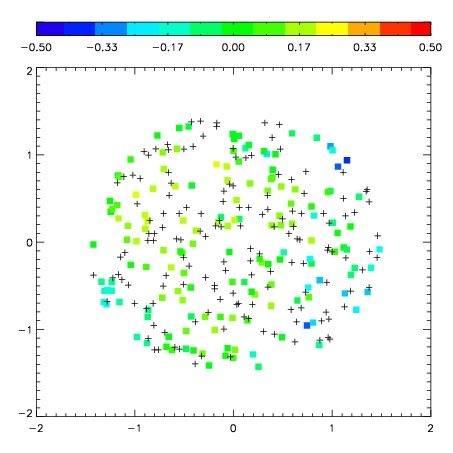
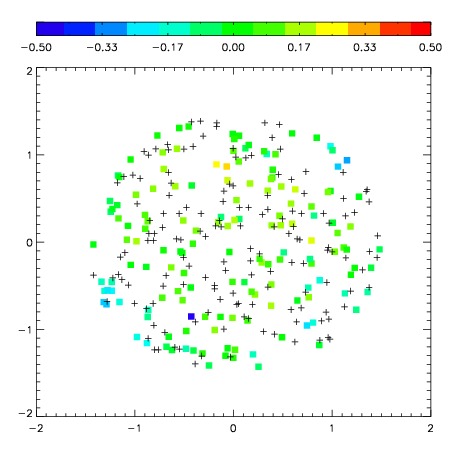
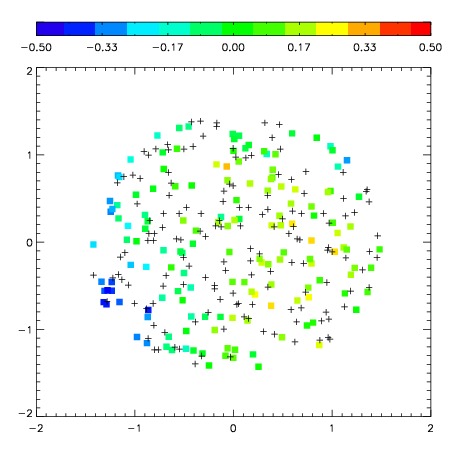
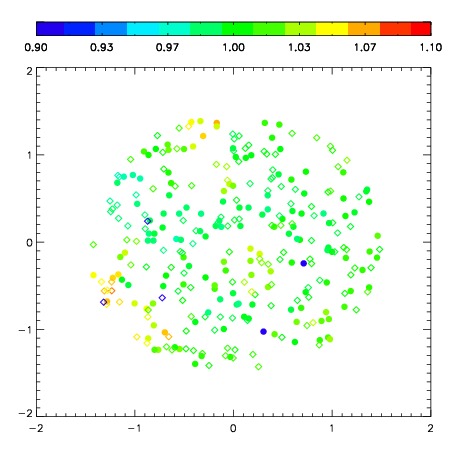
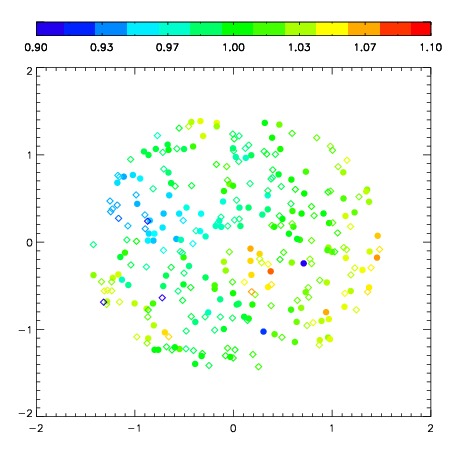
| Spatial mag deviation
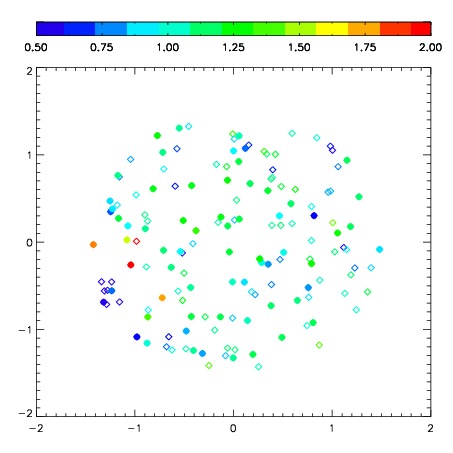
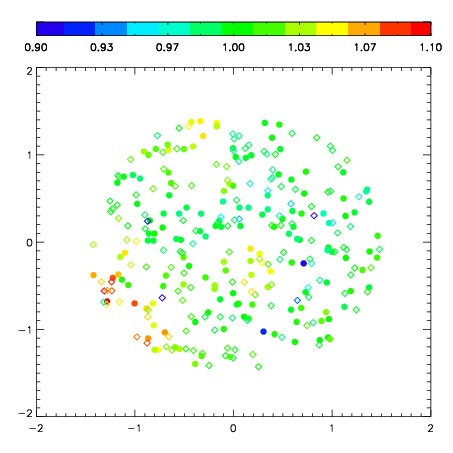
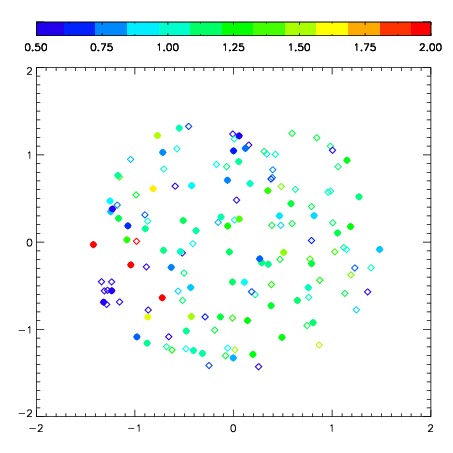
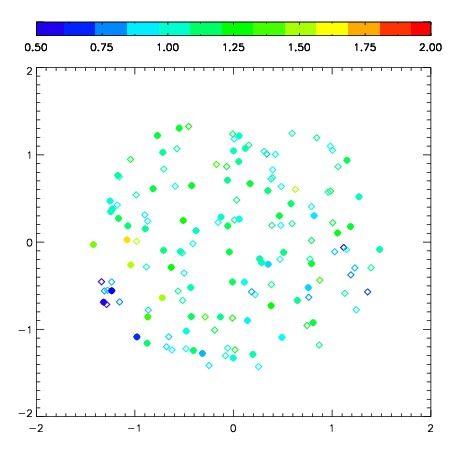
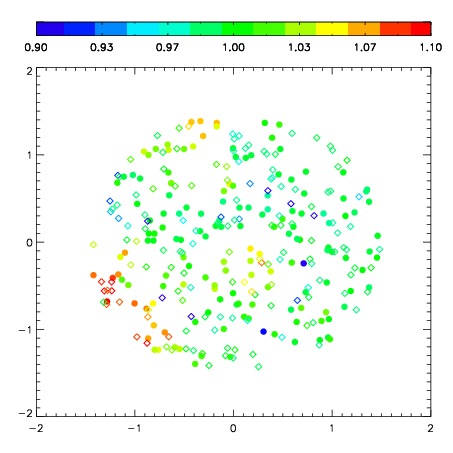
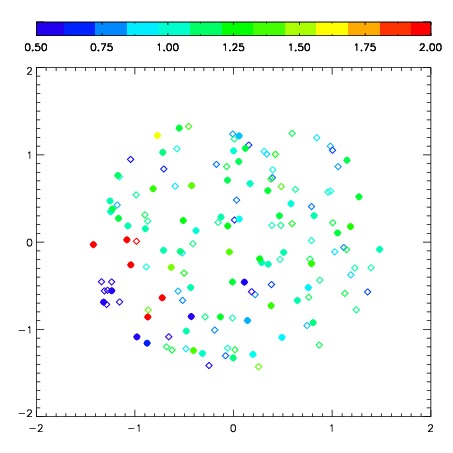
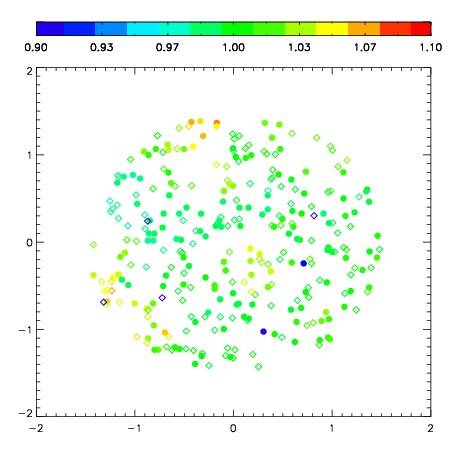
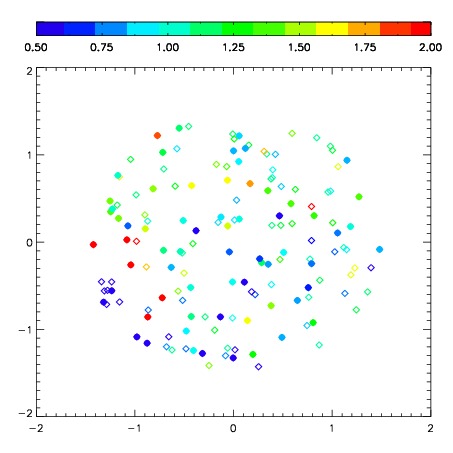
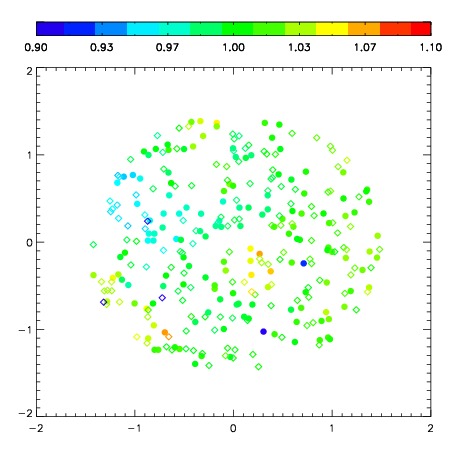
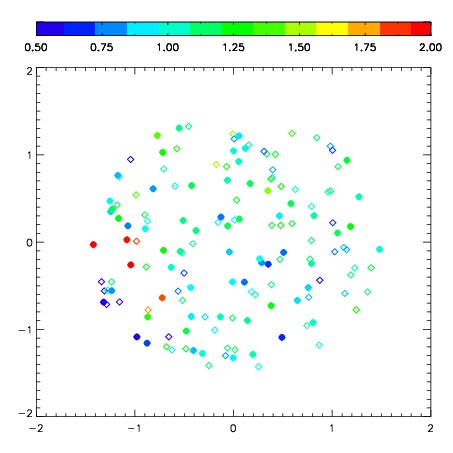
| Spatial sky 16325A emission deviations (filled: sky, open: star)
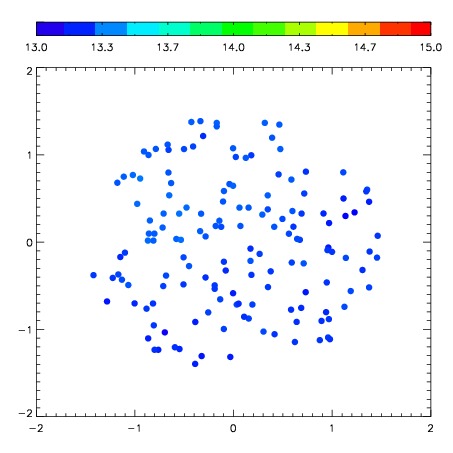
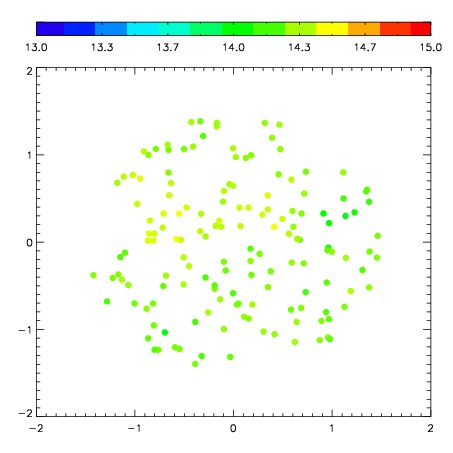
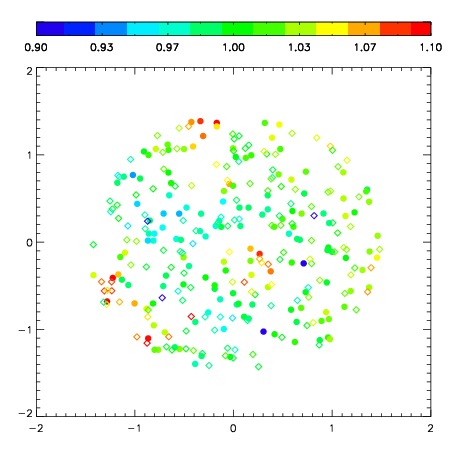
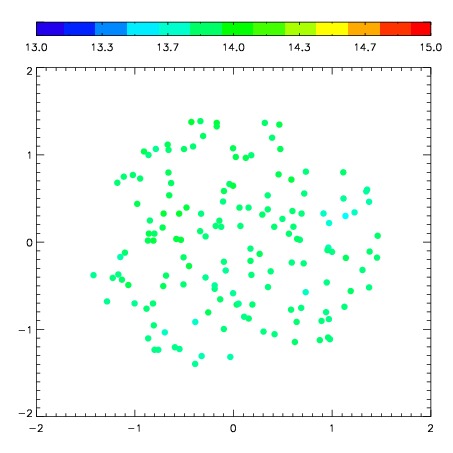
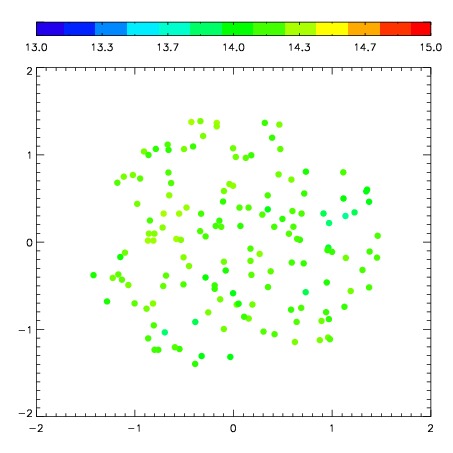
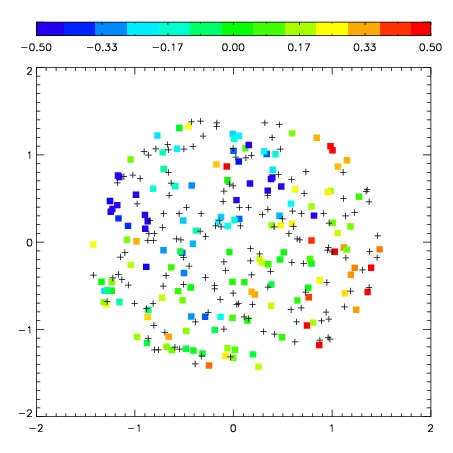
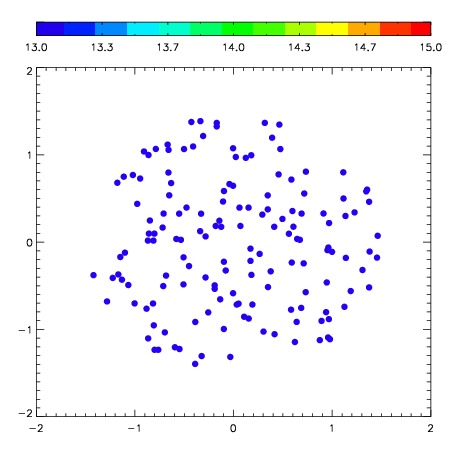
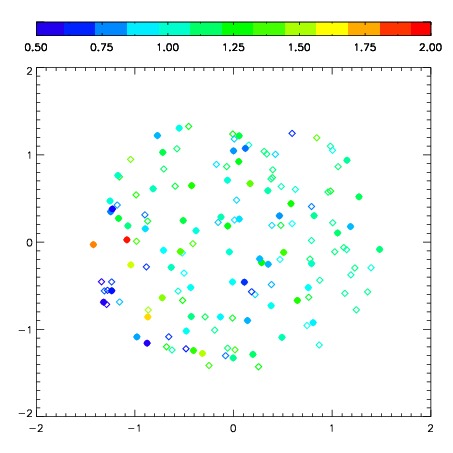
| Spatial sky continuum emission
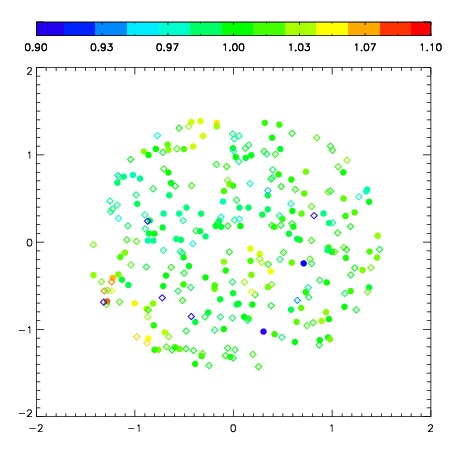
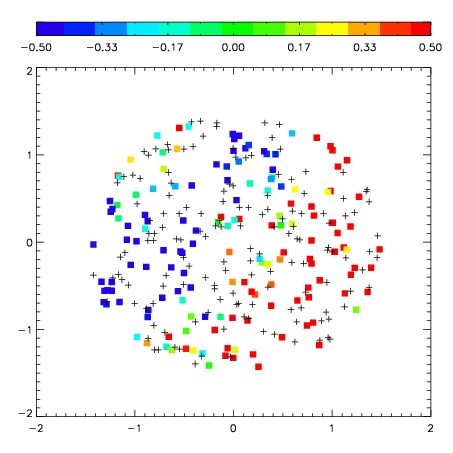
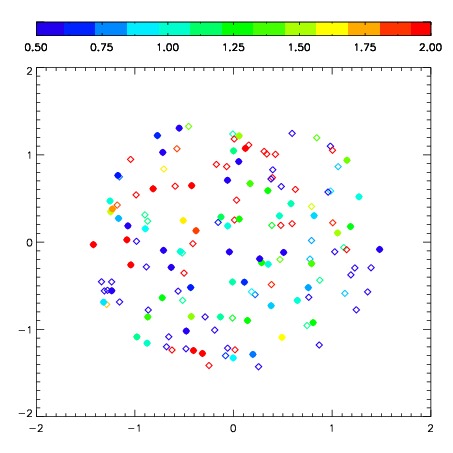
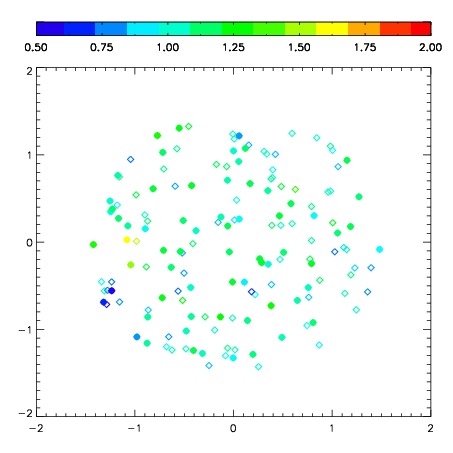
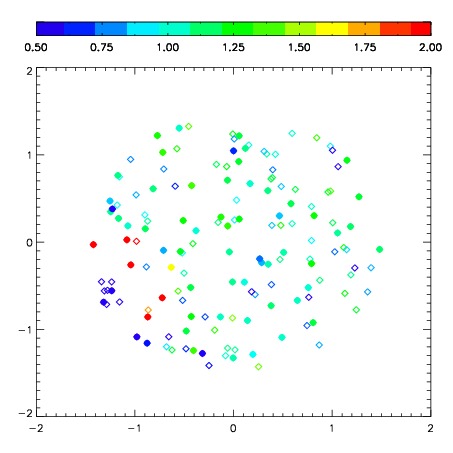
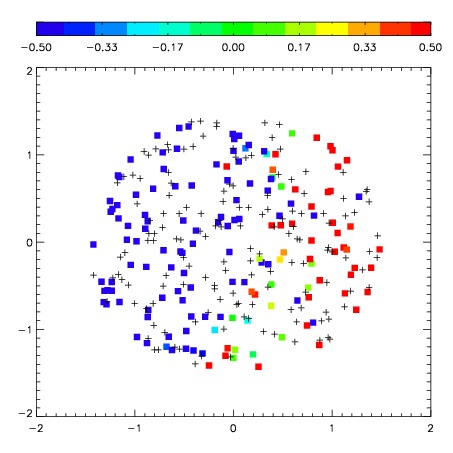
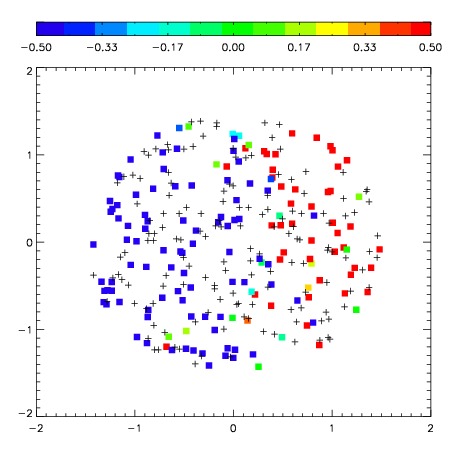
| Spatial sky telluric CO2 absorption deviations (filled: H < 10)
|
| 2540034
| 47
| | Red | Green | Blue
| | z | | 17.70
| | znorm | | 13.52
| | sky | 13.3 | 13.2 | 13.3
| | S/N | 7.4 | 12.2 | 13.7
| | S/N(c) | 6.3 | 11.5 | 13.1
| | SN(E/C) 1.00
|
| 
| 
| 
| 
| 
|
| 2540035
| 47
| | Red | Green | Blue
| | z | | 17.56
| | znorm | | 13.38
| | sky | 14.3 | 14.2 | 14.4
| | S/N | 6.7 | 11.5 | 12.8
| | S/N(c) | 5.8 | 10.9 | 12.1
| | SN(E/C) 0.95
|
| 
| 
| 
| 
| 
|
| 2540036
| 47
| | Red | Green | Blue
| | z | | 14.50
| | znorm | | 10.32
| | sky | 17.3 | 16.1 | 16.2
| | S/N | 0.3 | 1.0 | 0.9
| | S/N(c) | 0.3 | 1.0 | 0.9
| | SN(E/C) 1.52
|
| 
| 
| 
| 
| 
|
| 2540037
| 47
| | Red | Green | Blue
| | z | | 18.56
| | znorm | | 14.38
| | sky | 13.8 | 13.8 | 13.7
| | S/N | 12.7 | 19.7 | 22.4
| | S/N(c) | 11.4 | 18.8 | 21.7
| | SN(E/C) 0.95
|
| 
| 
| 
| 
| 
|
| 2540038
| 47
| | Red | Green | Blue
| | z | | 18.88
| | znorm | | 14.70
| | sky | 14.2 | 14.1 | 14.2
| | S/N | 15.6 | 23.6 | 27.1
| | S/N(c) | 14.2 | 22.7 | 26.0
| | SN(E/C) 0.92
|
| 
| 
| 
| 
| 
|
| 2540039
| 47
| | Red | Green | Blue
| | z | | 16.98
| | znorm | | 12.79
| | sky | 12.7 | 12.7 | 12.9
| | S/N | 3.8 | 6.7 | 8.6
| | S/N(c) | 3.2 | 6.1 | 7.9
| | SN(E/C) 1.02
|
| 
| 
| 
| 
| 
|
| 2540040
| 47
| | Red | Green | Blue
| | z | | 16.31
| | znorm | | 12.13
| | sky | 12.7 | 12.7 | 12.9
| | S/N | 2.1 | 4.0 | 5.2
| | S/N(c) | 1.9 | 3.5 | 4.7
| | SN(E/C) 1.01
|
| 
| 
| 
| 
| 
|
| 2540041
| 47
| | Red | Green | Blue
| | z | | 13.84
| | znorm | | 9.66
| | sky | 12.5 | 12.6 | 12.8
| | S/N | 0.1 | 0.5 | 0.7
| | S/N(c) | 0.1 | 0.5 | 0.7
| | SN(E/C) 6.80
|
| 
| 
| 
| 
| 
|
| 2540042
| 47
| | Red | Green | Blue
| | z | | 12.73
| | znorm | | 8.55
| | sky | 12.2 | 12.2 | 12.3
| | S/N | -0.0 | 0.2 | 0.3
| | S/N(c) | -0.0 | 0.2 | 0.3
| | SN(E/C)19.04
|
| 
| 
| 
| 
| 
|
| 2540043
| 47
| | Red | Green | Blue
| | z | | 12.94
| | znorm | | 8.76
| | sky | 12.1 | 12.1 | 12.1
| | S/N | 0.2 | 0.2 | 0.1
| | S/N(c) | 0.2 | 0.2 | 0.1
| | SN(E/C)13.30
|
| 
| 
| 
| 
| 
|
| 2540044
| 47
| | Red | Green | Blue
| | z | | 11.90
| | znorm | | 7.72
| | sky | 12.2 | 12.1 | 12.2
| | S/N | -0.0 | 0.1 | 0.1
| | S/N(c) | -0.0 | 0.1 | 0.1
| | SN(E/C)30.10
|
| 
| 
| 
| 
| 
|

