| Red | Green | Blue | |
| z | 17.64 | ||
| znorm | Inf | ||
| sky | -Inf | -Inf | -Inf |
| S/N | 42.4 | 59.0 | 60.5 |
| S/N(c) | 0.0 | 0.0 | 0.0 |
| SN(E/C) |
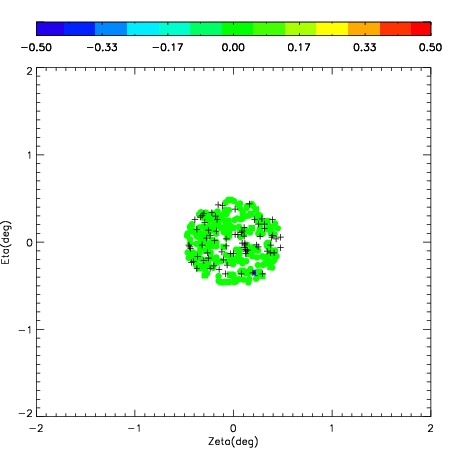
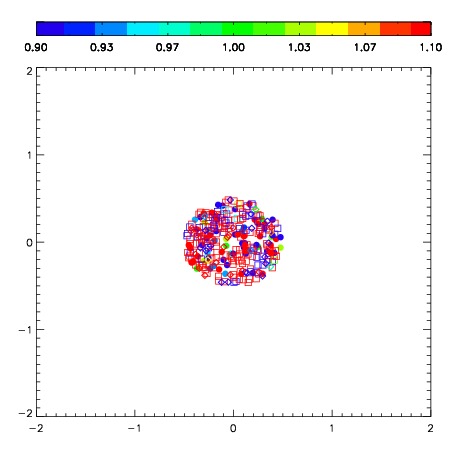
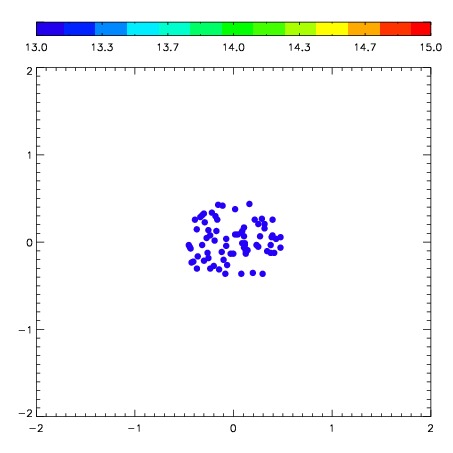
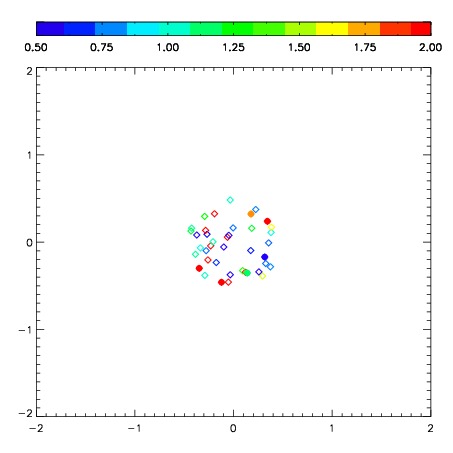
| Frame | Nreads | Zeropoints | Mag plots | Spatial mag deviation | Spatial sky 16325A emission deviations (filled: sky, open: star) | Spatial sky continuum emission | Spatial sky telluric CO2 absorption deviations (filled: H < 10) | |||||||||||||||||||||||
| 0 | 0 |
|
|
|
|
|
|
| 01690034 | 0.00000 | 235.376 |
| 01690035 | 0.00000 | 237.001 |
| 01690036 | 0.00000 | 245.279 |
| 01690037 | 0.00000 | 239.203 |
| 01690038 | 0.00000 | 247.567 |
| 01690039 | 0.00000 | 245.203 |
| 01690040 | 0.00000 | 247.841 |
| 01690041 | 0.00000 | 247.534 |