| Red | Green | Blue | |
| z | 17.64 | ||
| znorm | Inf | ||
| sky | -NaN | -NaN | -Inf |
| S/N | 57.4 | 79.8 | 81.3 |
| S/N(c) | 0.0 | 0.0 | 0.0 |
| SN(E/C) |

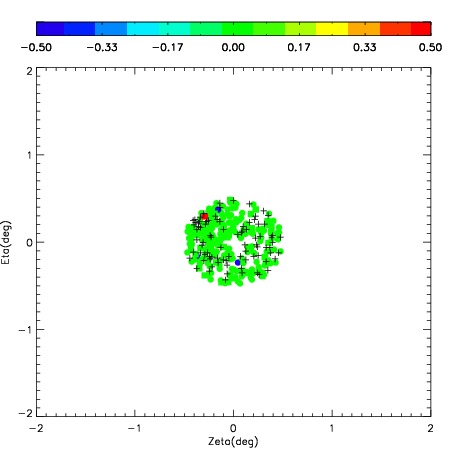
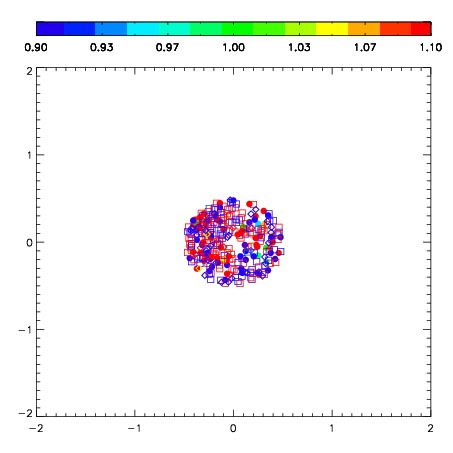


| Frame | Nreads | Zeropoints | Mag plots | Spatial mag deviation | Spatial sky 16325A emission deviations (filled: sky, open: star) | Spatial sky continuum emission | Spatial sky telluric CO2 absorption deviations (filled: H < 10) | |||||||||||||||||||||||
| 0 | 0 |
|
|
|
|
|
|
| 01650044 | 0.00000 | 225.753 |
| 01650045 | 0.00000 | 241.321 |
| 01650046 | 0.00000 | 252.547 |
| 01650047 | 0.00000 | 251.294 |
| 01650048 | 0.00000 | 240.325 |
| 01650049 | 0.00000 | 242.114 |
| 01650050 | 0.00000 | 248.743 |
| 01650051 | 0.00000 | 246.289 |
| 01650052 | 0.00000 | 238.590 |
| 01650053 | 0.00000 | 237.758 |
| 01650054 | 0.00000 | 227.462 |
| 01650055 | 0.00000 | 241.340 |
| 01650056 | 0.00000 | 248.796 |