| Red | Green | Blue | |
| z | 17.64 | ||
| znorm | Inf | ||
| sky | -NaN | -NaN | -Inf |
| S/N | 55.2 | 79.0 | 83.2 |
| S/N(c) | 0.0 | 0.0 | 0.0 |
| SN(E/C) |
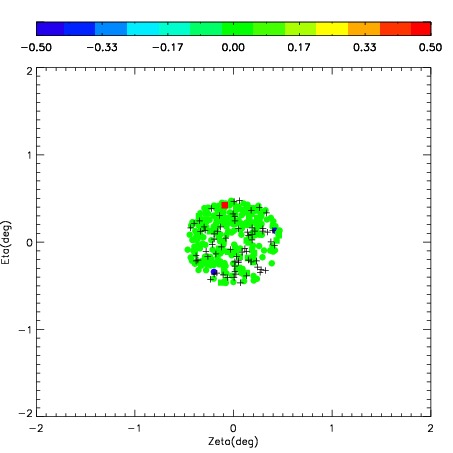
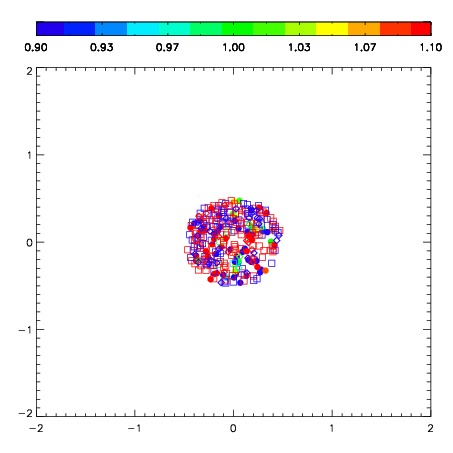
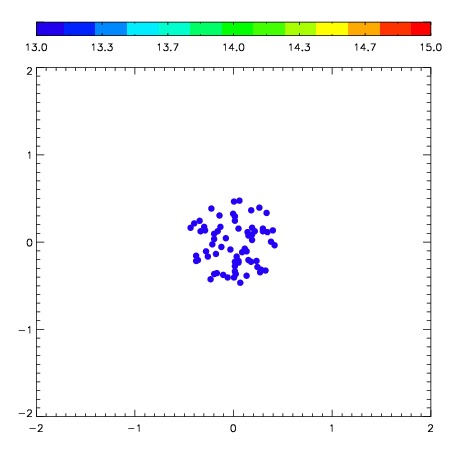
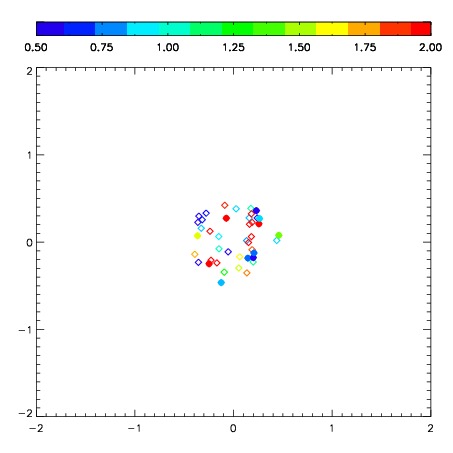
| Frame | Nreads | Zeropoints | Mag plots | Spatial mag deviation | Spatial sky 16325A emission deviations (filled: sky, open: star) | Spatial sky continuum emission | Spatial sky telluric CO2 absorption deviations (filled: H < 10) | |||||||||||||||||||||||
| 0 | 0 |
|
|
|
|
|
|
| 01630046 | 0.00000 | 243.177 |
| 01630047 | 0.00000 | 0.00000 |
| 01630048 | 0.00000 | 256.842 |
| 01630049 | 0.00000 | 247.986 |
| 01630050 | 0.00000 | 0.00000 |
| 01630051 | 0.00000 | 243.944 |
| 01630052 | 0.00000 | 0.00000 |
| 01630053 | 0.00000 | 0.00000 |
| 01630054 | 0.00000 | 0.00000 |
| 01630055 | 0.00000 | 252.368 |
| 01630056 | 0.00000 | 242.563 |