| Red | Green | Blue | |
| z | 17.64 | ||
| znorm | Inf | ||
| sky | -NaN | -Inf | -Inf |
| S/N | 65.3 | 96.2 | 110.3 |
| S/N(c) | 0.0 | 0.0 | 0.0 |
| SN(E/C) |

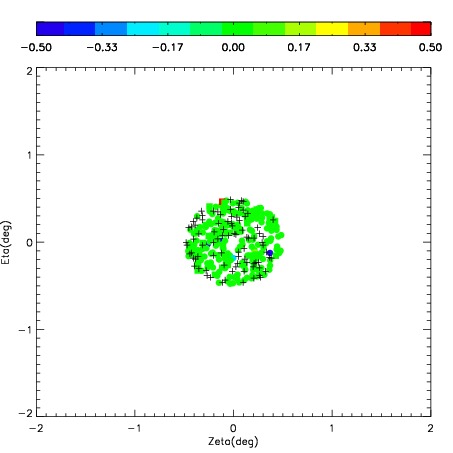
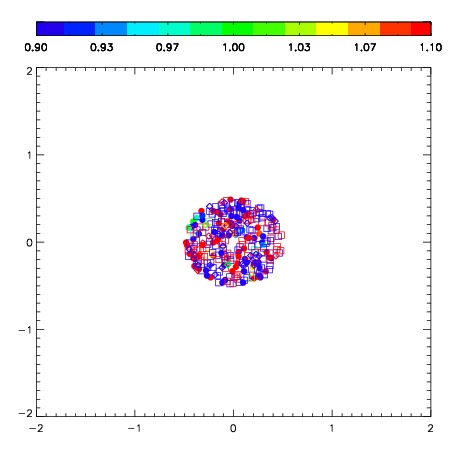


| Frame | Nreads | Zeropoints | Mag plots | Spatial mag deviation | Spatial sky 16325A emission deviations (filled: sky, open: star) | Spatial sky continuum emission | Spatial sky telluric CO2 absorption deviations (filled: H < 10) | |||||||||||||||||||||||
| 0 | 0 |
|
|
|
|
|
|
| 01610048 | 0.00000 | 236.895 |
| 01610049 | 0.00000 | 241.364 |
| 01610050 | 0.00000 | 241.338 |
| 01610051 | 0.00000 | 242.065 |
| 01610052 | 0.00000 | 238.189 |
| 01610053 | 0.00000 | 234.052 |
| 01610054 | 0.00000 | 241.802 |
| 01610055 | 0.00000 | 223.801 |
| 01610056 | 0.00000 | 248.624 |
| 01610057 | 0.00000 | 253.612 |
| 01610058 | 0.00000 | 253.082 |
| 01610059 | 0.00000 | 259.091 |
| 01610060 | 0.00000 | 260.025 |