| Red | Green | Blue | |
| z | 17.64 | ||
| znorm | Inf | ||
| sky | -Inf | -NaN | -Inf |
| S/N | 35.0 | 58.5 | 65.6 |
| S/N(c) | 0.0 | 0.0 | 0.0 |
| SN(E/C) |

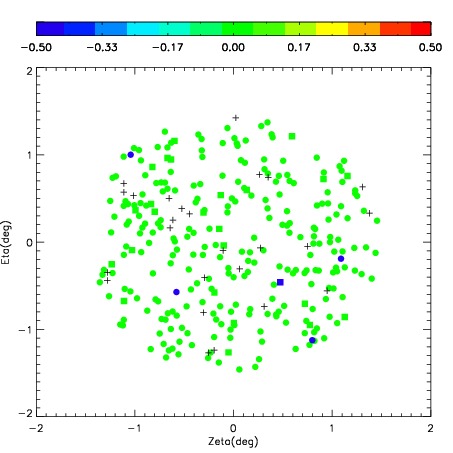
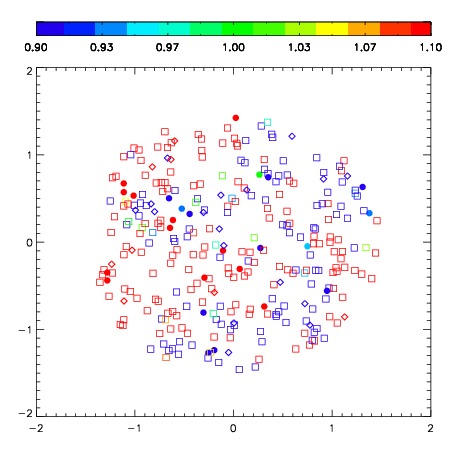


| Frame | Nreads | Zeropoints | Mag plots | Spatial mag deviation | Spatial sky 16325A emission deviations (filled: sky, open: star) | Spatial sky continuum emission | Spatial sky telluric CO2 absorption deviations (filled: H < 10) | |||||||||||||||||||||||
| 0 | 0 |
|
|
|
|
|
|
| 01660010 | 0.00000 | 297.618 |
| 01660011 | 0.00000 | 297.625 |
| 01660012 | 0.00000 | 297.614 |
| 01660013 | 0.00000 | 297.033 |
| 01660014 | 0.00000 | 295.429 |
| 01660015 | 0.00000 | 295.407 |