| Red | Green | Blue | |
| z | 17.63 | ||
| znorm | Inf | ||
| sky | -NaN | -NaN | -Inf |
| S/N | 34.8 | 61.4 | 68.1 |
| S/N(c) | 0.0 | 0.0 | 0.0 |
| SN(E/C) |

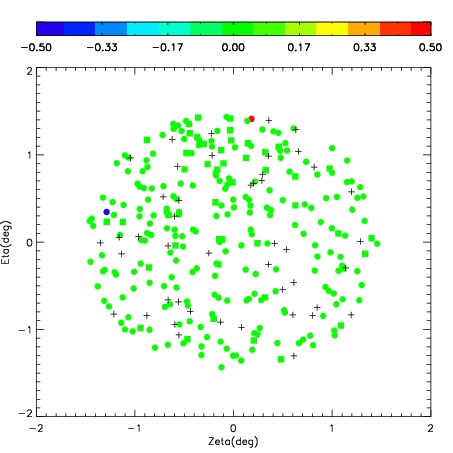
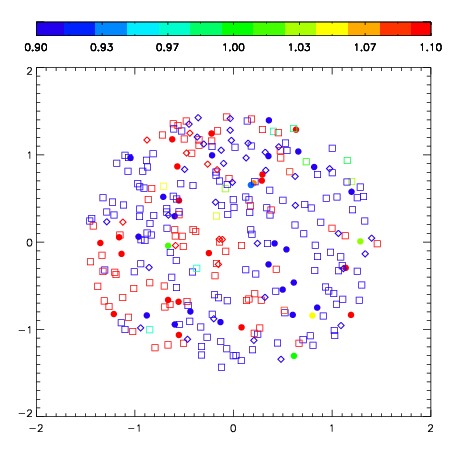
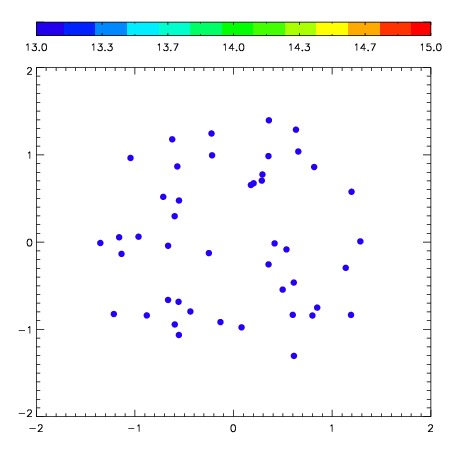
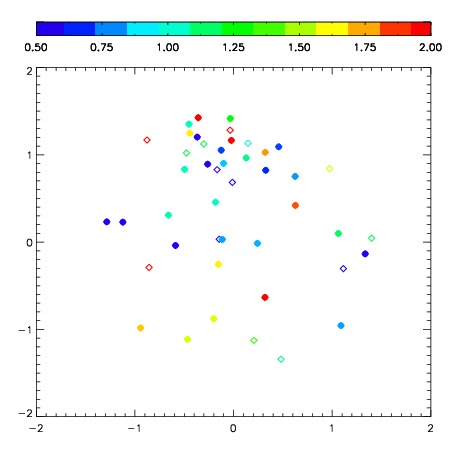
| Frame | Nreads | Zeropoints | Mag plots | Spatial mag deviation | Spatial sky 16325A emission deviations (filled: sky, open: star) | Spatial sky continuum emission | Spatial sky telluric CO2 absorption deviations (filled: H < 10) | |||||||||||||||||||||||
| 0 | 0 |
|
|
|
|
|
|
| 01650076 | 0.00000 | 200.939 |
| 01650077 | 0.00000 | 200.632 |
| 01650078 | 0.00000 | 165.510 |
| 01650079 | 0.00000 | 129.212 |
| 01650080 | 0.00000 | 199.681 |
| 01650081 | 0.00000 | 165.039 |
| 01650082 | 0.00000 | 109.386 |
| 01650083 | 0.00000 | 61.1198 |
| 01650084 | 0.00000 | 195.193 |
| 01650085 | 0.00000 | 271.669 |
| 01650086 | 0.00000 | 273.269 |
| 01650087 | 0.00000 | 275.390 |
| 01650088 | 0.00000 | 282.803 |
| 01650089 | 0.00000 | 283.115 |
| 01650090 | 0.00000 | 289.739 |