| Red | Green | Blue | |
| z | 17.64 | ||
| znorm | Inf | ||
| sky | -Inf | -Inf | -Inf |
| S/N | 17.8 | 30.3 | 35.1 |
| S/N(c) | 0.0 | 0.0 | 0.0 |
| SN(E/C) |

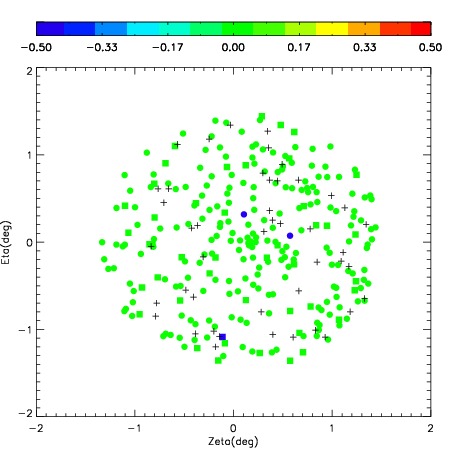

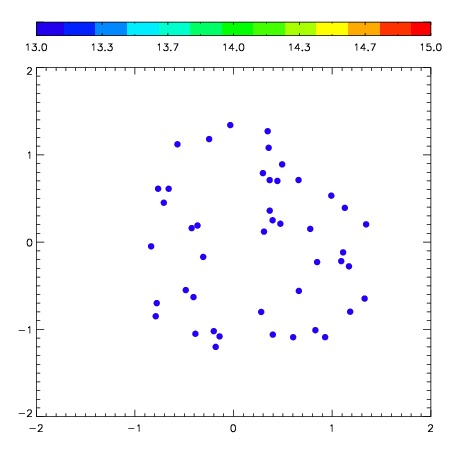
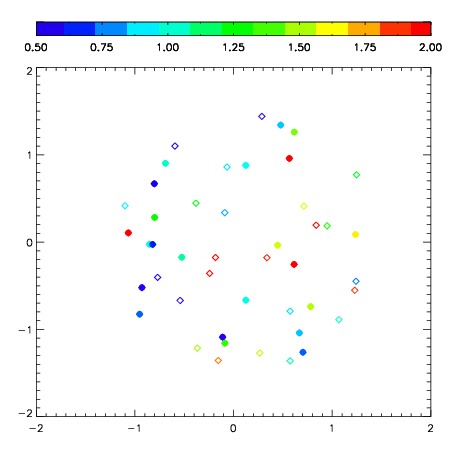
| Frame | Nreads | Zeropoints | Mag plots | Spatial mag deviation | Spatial sky 16325A emission deviations (filled: sky, open: star) | Spatial sky continuum emission | Spatial sky telluric CO2 absorption deviations (filled: H < 10) | |||||||||||||||||||||||
| 0 | 0 |
|
|
|
|
|
|
| 01970042 | 0.00000 | 231.518 |
| 01970043 | 0.00000 | 213.151 |
| 01970044 | 0.00000 | 185.088 |
| 01970045 | 0.00000 | 149.489 |
| 01970046 | 0.00000 | 211.925 |
| 01970047 | 0.00000 | 179.947 |
| 01970048 | 0.00000 | 25.2810 |