| Red | Green | Blue | |
| z | 17.64 | ||
| znorm | Inf | ||
| sky | -Inf | -Inf | -Inf |
| S/N | 25.0 | 43.1 | 47.1 |
| S/N(c) | 0.0 | 0.0 | 0.0 |
| SN(E/C) |

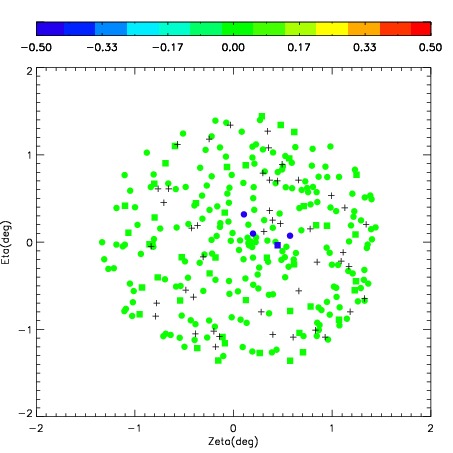
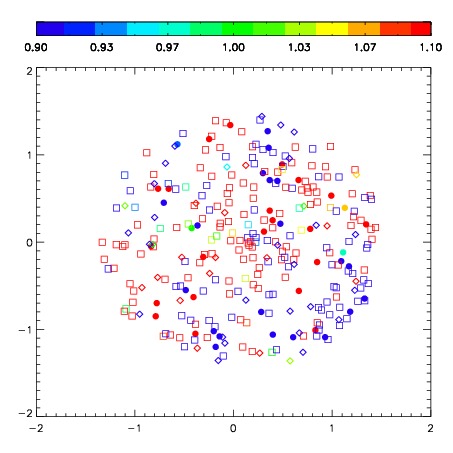
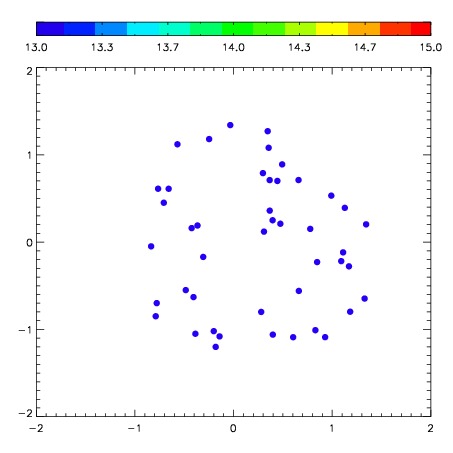

| Frame | Nreads | Zeropoints | Mag plots | Spatial mag deviation | Spatial sky 16325A emission deviations (filled: sky, open: star) | Spatial sky continuum emission | Spatial sky telluric CO2 absorption deviations (filled: H < 10) | |||||||||||||||||||||||
| 0 | 0 |
|
|
|
|
|
|
| IPAIR | NAME | SHIFT | NEWSHIFT | S/N | NAME | SHIFT | NEWSHIFT | S/N |
| 0 | 02590017 | 0.315109 | 0.00000 | 285.981 | 02590015 | -0.0329958 | 0.348105 | 274.878 |
| 1 | 02590013 | 0.300403 | 0.0147060 | 281.433 | 02590014 | -0.0292937 | 0.344403 | 270.989 |
| 2 | 02590016 | 0.309964 | 0.00514501 | 270.645 | 02590011 | 0.00000 | 0.315109 | 264.631 |
| 3 | 02590012 | 0.311797 | 0.00331202 | 260.674 | 02590018 | -0.0318254 | 0.346934 | 261.868 |