| Red | Green | Blue | |
| z | 17.64 | ||
| znorm | Inf | ||
| sky | -Inf | -Inf | -Inf |
| S/N | 5.9 | 13.7 | 14.1 |
| S/N(c) | 0.0 | 0.0 | 0.0 |
| SN(E/C) |
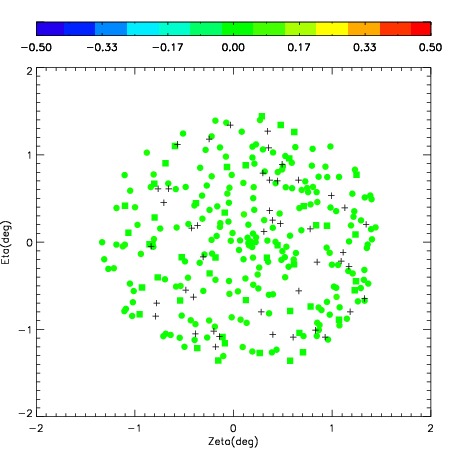

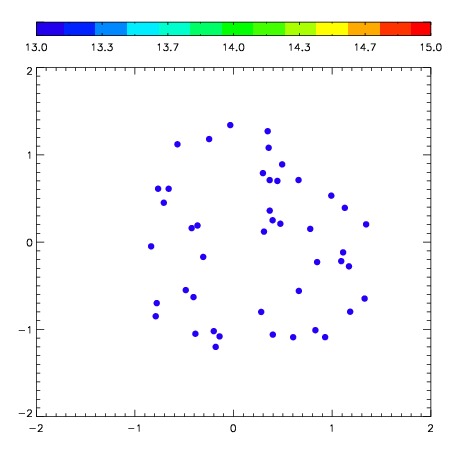

| Frame | Nreads | Zeropoints | Mag plots | Spatial mag deviation | Spatial sky 16325A emission deviations (filled: sky, open: star) | Spatial sky continuum emission | Spatial sky telluric CO2 absorption deviations (filled: H < 10) | |||||||||||||||||||||||
| 0 | 0 |
|
|
|
|
|
|
| IPAIR | NAME | SHIFT | NEWSHIFT | S/N | NAME | SHIFT | NEWSHIFT | S/N |
| 0 | 03060010 | 0.453614 | 0.00000 | 115.509 | 03060011 | -0.0174002 | 0.471014 | 104.412 |
| 1 | 03060009 | 0.452017 | 0.00159699 | 117.261 | 03060008 | 0.00000 | 0.453614 | 116.486 |
| 2 | 03060013 | 0.447058 | 0.00655600 | 98.6223 | 03060012 | -0.0244156 | 0.478030 | 100.746 |
| 3 | 03060014 | 0.450360 | 0.00325400 | 92.0816 | 03060015 | -0.0206830 | 0.474297 | 98.0982 |