| Red | Green | Blue | |
| z | 17.64 | ||
| znorm | Inf | ||
| sky | -NaN | -Inf | -Inf |
| S/N | 24.7 | 42.9 | 47.9 |
| S/N(c) | 0.0 | 0.0 | 0.0 |
| SN(E/C) |

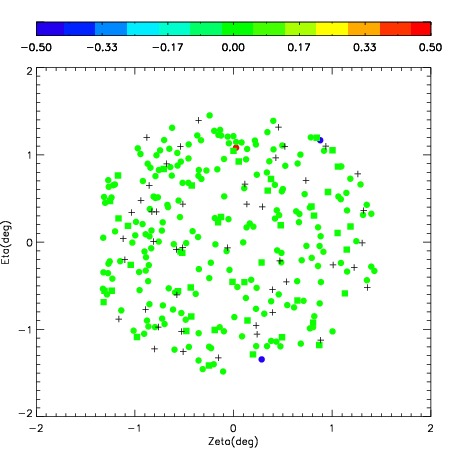
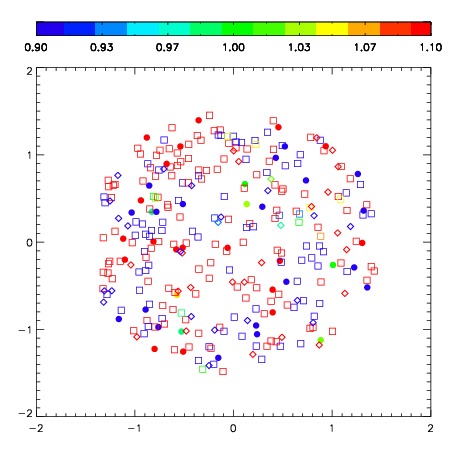
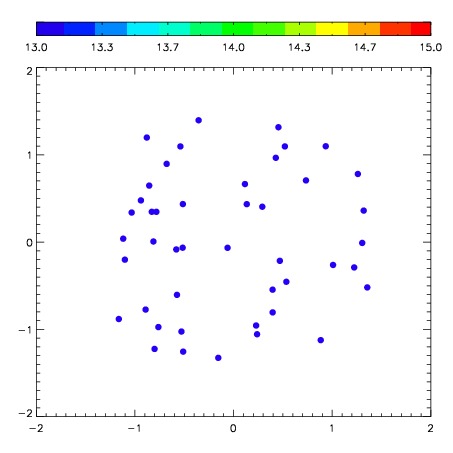
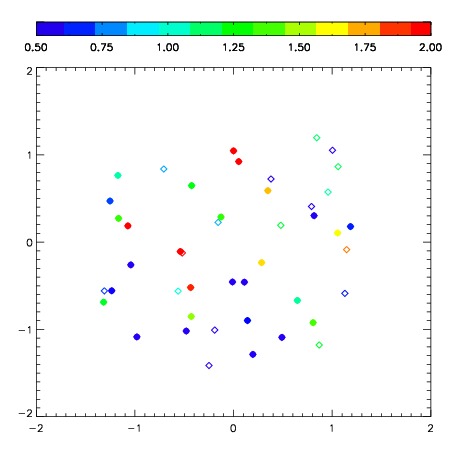
| Frame | Nreads | Zeropoints | Mag plots | Spatial mag deviation | Spatial sky 16325A emission deviations (filled: sky, open: star) | Spatial sky continuum emission | Spatial sky telluric CO2 absorption deviations (filled: H < 10) | |||||||||||||||||||||||
| 0 | 0 |
|
|
|
|
|
|
| 01700038 | 0.00000 | 227.363 |
| 01700039 | 0.00000 | 241.632 |
| 01700040 | 0.00000 | 250.120 |
| 01700041 | 0.00000 | 258.883 |
| 01700042 | 0.00000 | 240.953 |
| 01700043 | 0.00000 | 205.850 |
| 01700044 | 0.00000 | 229.561 |