| Red | Green | Blue | |
| z | 17.64 | ||
| znorm | Inf | ||
| sky | -NaN | -NaN | -Inf |
| S/N | 41.3 | 59.5 | 69.4 |
| S/N(c) | 0.0 | 0.0 | 0.0 |
| SN(E/C) |

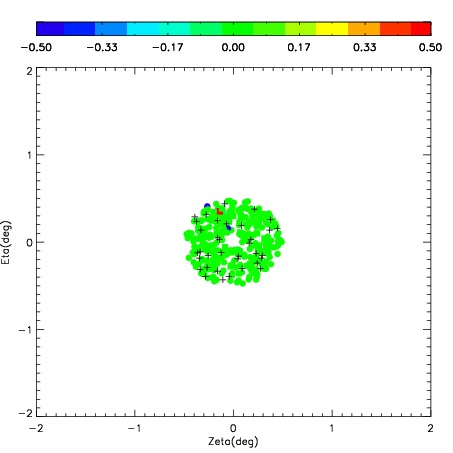

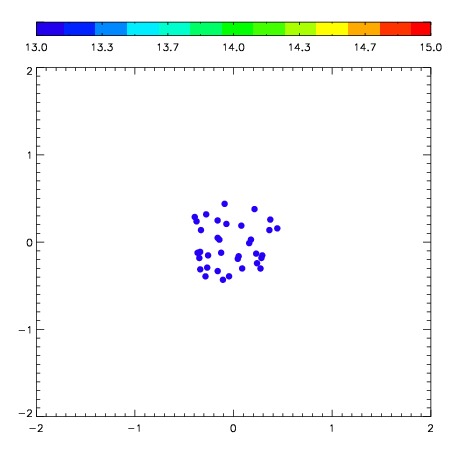
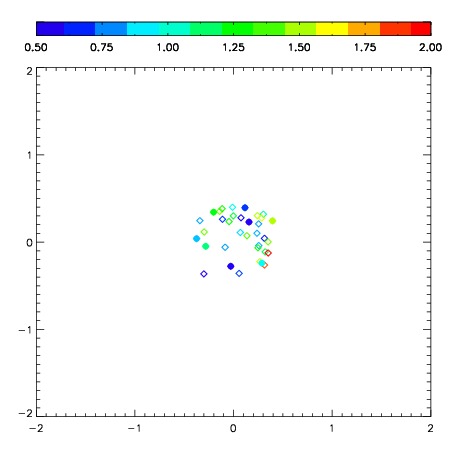
| Frame | Nreads | Zeropoints | Mag plots | Spatial mag deviation | Spatial sky 16325A emission deviations (filled: sky, open: star) | Spatial sky continuum emission | Spatial sky telluric CO2 absorption deviations (filled: H < 10) | |||||||||||||||||||||||
| 0 | 0 |
|
|
|
|
|
|
| 01710064 | 0.00000 | 213.451 |
| 01710065 | 0.00000 | 235.307 |
| 01710066 | 0.00000 | 226.724 |
| 01710067 | 0.00000 | 215.727 |
| 01710068 | 0.00000 | 223.434 |
| 01710069 | 0.00000 | 234.601 |
| 01710070 | 0.00000 | 245.059 |
| 01710071 | 0.00000 | 242.283 |