| Red | Green | Blue | |
| z | 17.64 | ||
| znorm | Inf | ||
| sky | -NaN | -Inf | -Inf |
| S/N | 32.5 | 53.8 | 63.0 |
| S/N(c) | 0.0 | 0.0 | 0.0 |
| SN(E/C) |


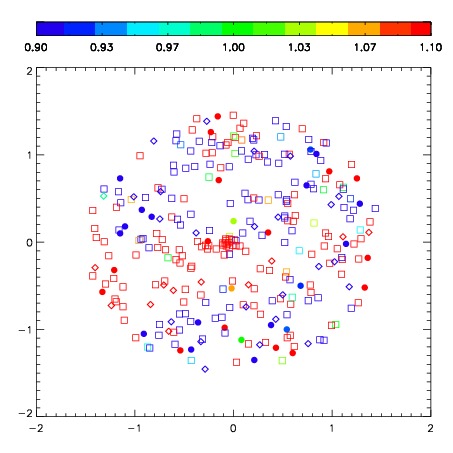


| Frame | Nreads | Zeropoints | Mag plots | Spatial mag deviation | Spatial sky 16325A emission deviations (filled: sky, open: star) | Spatial sky continuum emission | Spatial sky telluric CO2 absorption deviations (filled: H < 10) | |||||||||||||||||||||||
| 0 | 0 |
|
|
|
|
|
|
| 01980052 | 0.00000 | 248.027 |
| 01980053 | 0.00000 | 233.942 |
| 01980054 | 0.00000 | 241.466 |
| 01980055 | 0.00000 | 234.723 |
| 01980056 | 0.00000 | 236.438 |
| 01980057 | 0.00000 | 221.588 |
| 01980058 | 0.00000 | 226.630 |
| 01980059 | 0.00000 | 227.849 |