| Frame | Nreads | Zeropoints | Mag plots
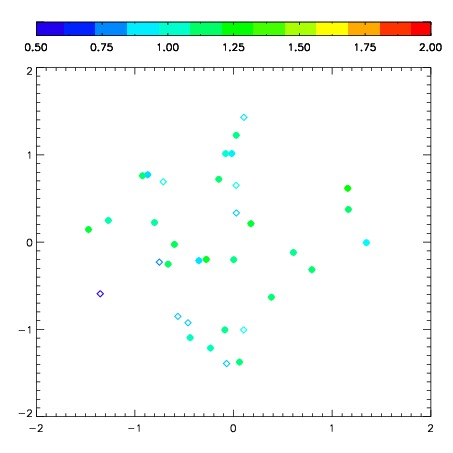
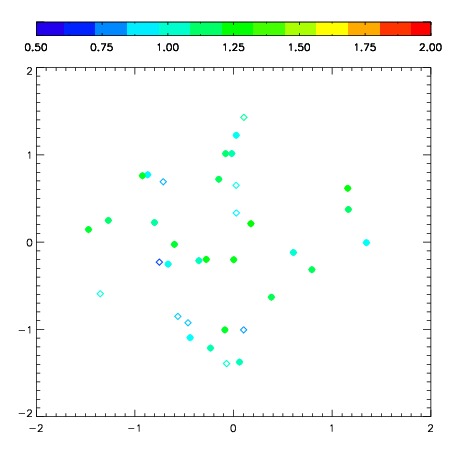
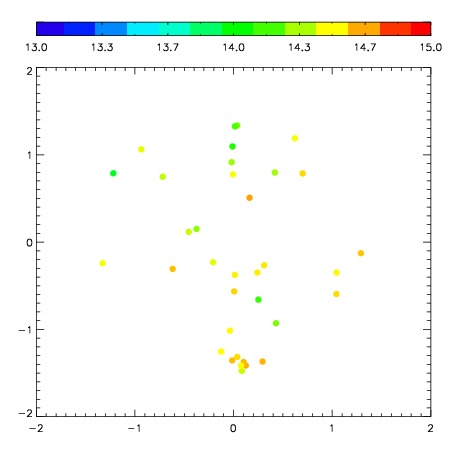
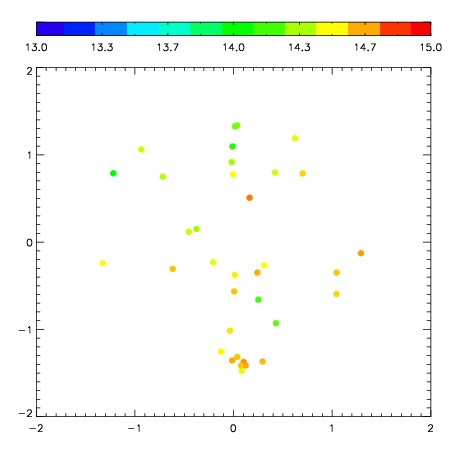
| Spatial mag deviation
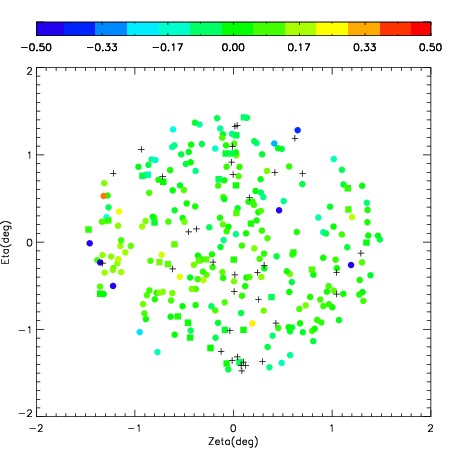
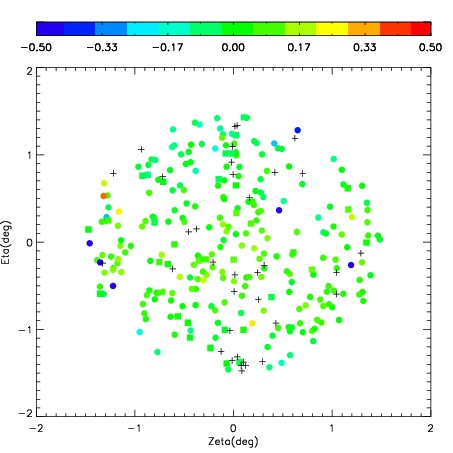
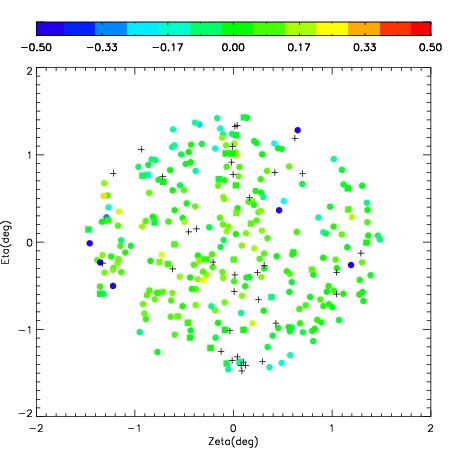
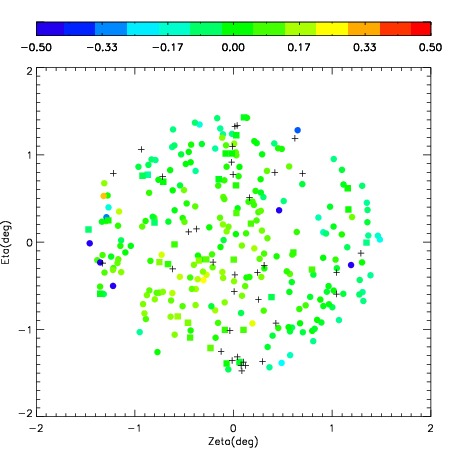
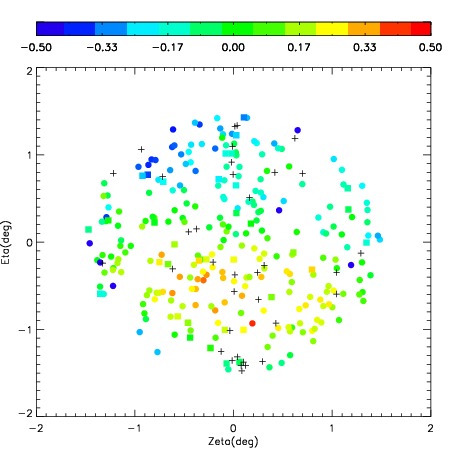
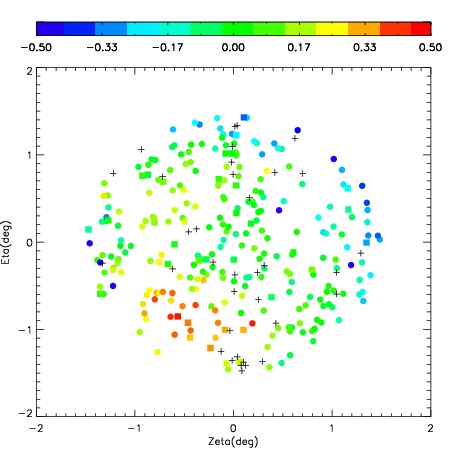
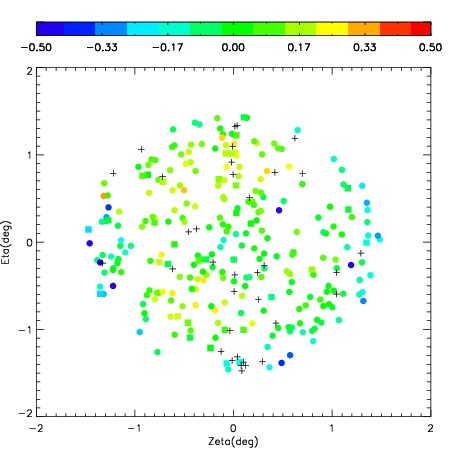
| Spatial sky 16325A emission deviations (filled: sky, open: star)
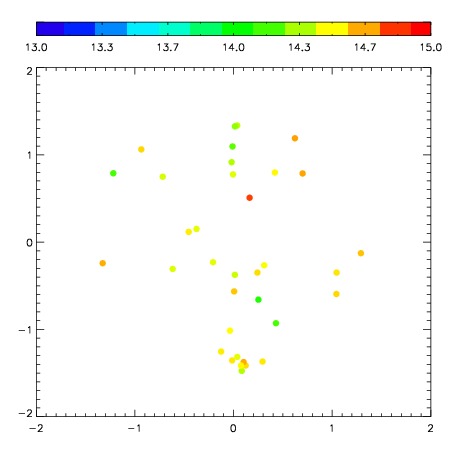
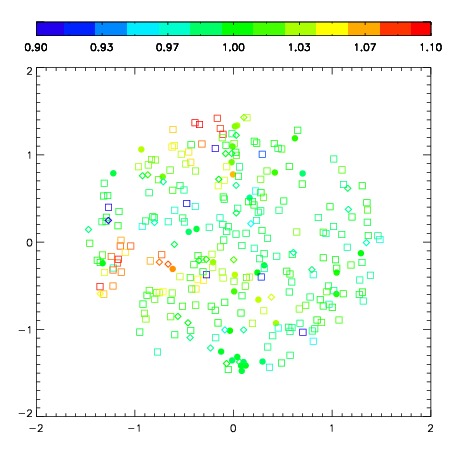
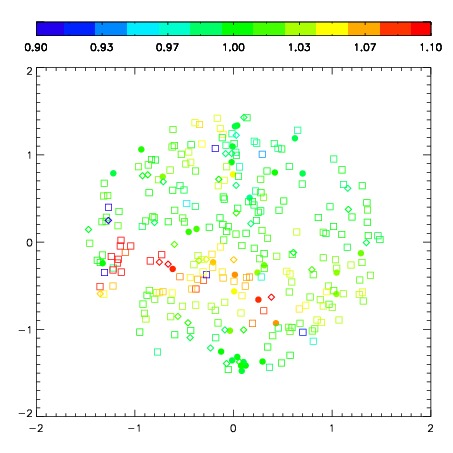
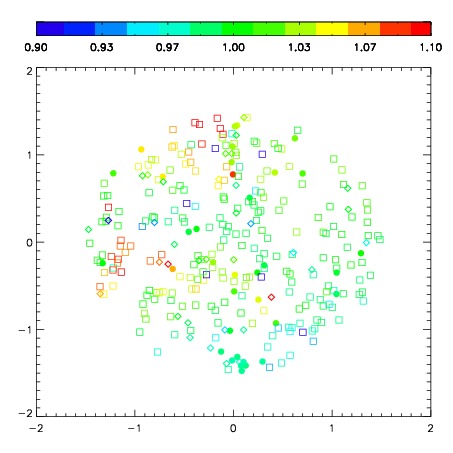
| Spatial sky continuum emission
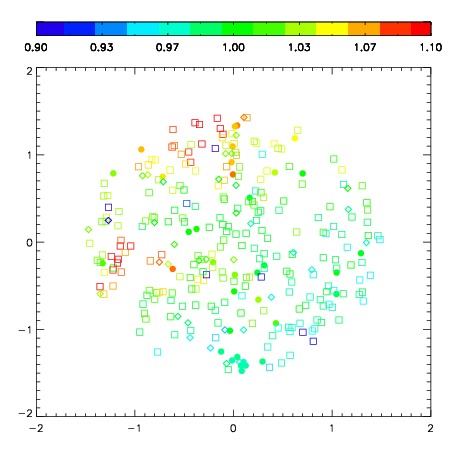
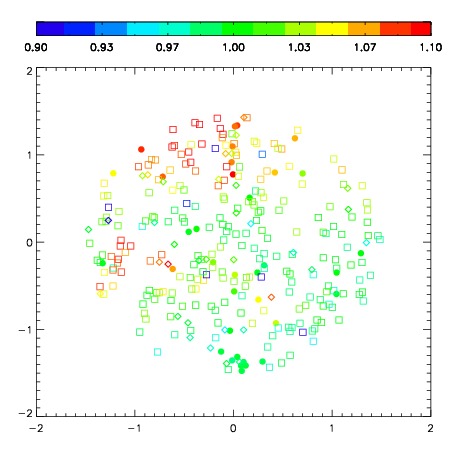
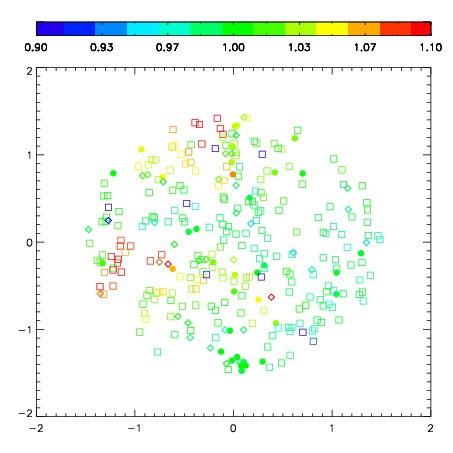
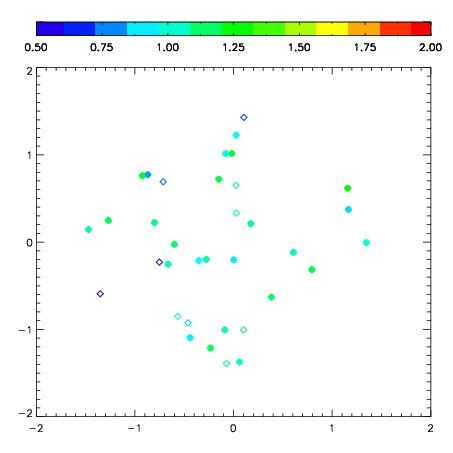
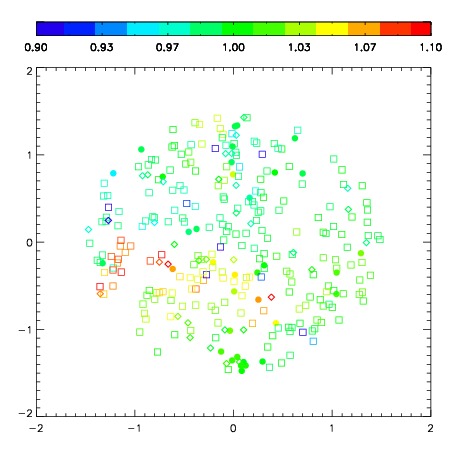
| Spatial sky telluric CO2 absorption deviations (filled: H < 10)
|
| 2620040
| 47
| | Red | Green | Blue
| | z | | 17.88
| | znorm | | 13.70
| | sky | 14.9 | 14.4 | 14.3
| | S/N | 6.2 | 11.6 | 12.0
| | S/N(c) | 5.3 | 10.6 | 11.8
| | SN(E/C) 0.84
|
| 
| 
| 
| 
| 
|
| 2620041
| 47
| | Red | Green | Blue
| | z | | 17.99
| | znorm | | 13.81
| | sky | 14.6 | 14.5 | 14.3
| | S/N | 6.9 | 13.0 | 13.0
| | S/N(c) | 5.8 | 11.4 | 13.2
| | SN(E/C) 0.86
|
| 
| 
| 
| 
| 
|
| 2620042
| 47
| | Red | Green | Blue
| | z | | 18.27
| | znorm | | 14.09
| | sky | 14.6 | 14.4 | 14.2
| | S/N | 8.4 | 15.2 | 15.6
| | S/N(c) | 7.2 | 13.7 | 15.9
| | SN(E/C) 0.86
|
| 
| 
| 
| 
| 
|
| 2620043
| 47
| | Red | Green | Blue
| | z | | 18.22
| | znorm | | 14.04
| | sky | 14.6 | 14.4 | 14.2
| | S/N | 8.3 | 15.0 | 15.0
| | S/N(c) | 7.0 | 13.6 | 15.3
| | SN(E/C) 0.84
|
| 
| 
| 
| 
| 
|
| 2620044
| 47
| | Red | Green | Blue
| | z | | 17.18
| | znorm | | 13.00
| | sky | 14.4 | 14.2 | 14.2
| | S/N | 3.3 | 6.8 | 6.9
| | S/N(c) | 2.9 | 6.3 | 6.7
| | SN(E/C) 0.98
|
| 
| 
| 
| 
| 
|
| 2620045
| 47
| | Red | Green | Blue
| | z | | 17.03
| | znorm | | 12.85
| | sky | 14.2 | 14.1 | 14.1
| | S/N | 3.0 | 6.3 | 6.9
| | S/N(c) | 2.6 | 5.8 | 6.7
| | SN(E/C) 1.00
|
| 
| 
| 
| 
| 
|
| 2620046
| 47
| | Red | Green | Blue
| | z | | 18.60
| | znorm | | 14.42
| | sky | 14.6 | 14.5 | 14.1
| | S/N | 10.9 | 18.9 | 19.8
| | S/N(c) | 9.3 | 16.8 | 19.2
| | SN(E/C) 0.80
|
| 
| 
| 
| 
| 
|
| 2620047
| 47
| | Red | Green | Blue
| | z | | 17.68
| | znorm | | 13.50
| | sky | 14.3 | 14.2 | 14.1
| | S/N | 5.4 | 10.4 | 10.0
| | S/N(c) | 4.5 | 9.0 | 10.1
| | SN(E/C) 0.88
|
| 
| 
| 
| 
| 
|

