| Red | Green | Blue | |
| z | 17.64 | ||
| znorm | Inf | ||
| sky | -Inf | -Inf | -Inf |
| S/N | 11.0 | 21.3 | 23.7 |
| S/N(c) | 0.0 | 0.0 | 0.0 |
| SN(E/C) |
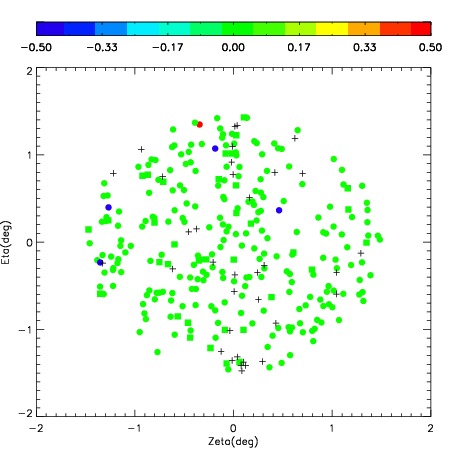
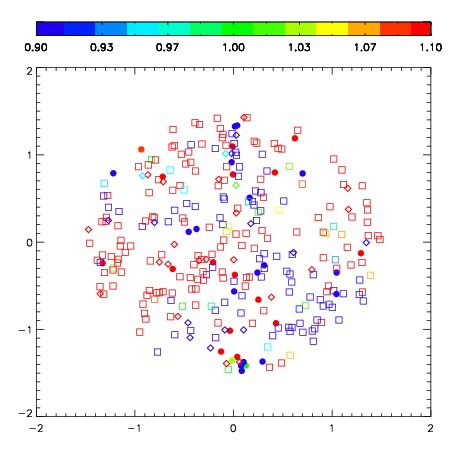
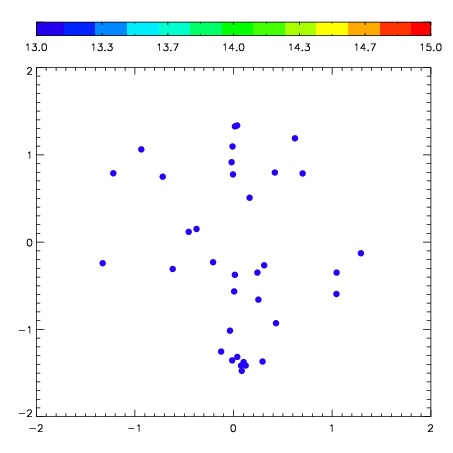
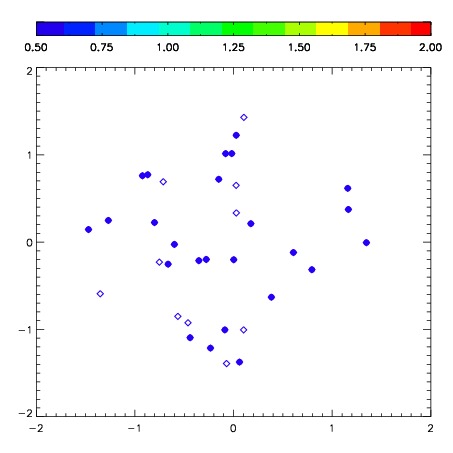
| Frame | Nreads | Zeropoints | Mag plots | Spatial mag deviation | Spatial sky 16325A emission deviations (filled: sky, open: star) | Spatial sky continuum emission | Spatial sky telluric CO2 absorption deviations (filled: H < 10) | |||||||||||||||||||||||
| 0 | 0 |
|
|
|
|
|
|
| IPAIR | NAME | SHIFT | NEWSHIFT | S/N | NAME | SHIFT | NEWSHIFT | S/N |
| 0 | 02620041 | 0.405006 | 0.00000 | 156.501 | 02620047 | 0.0115592 | 0.393447 | 133.063 |
| 1 | 02620046 | 0.404904 | 0.000101984 | 216.618 | 02620043 | 0.0181170 | 0.386889 | 175.667 |
| 2 | 02620042 | 0.398732 | 0.00627398 | 181.347 | 02620040 | 0.00000 | 0.405006 | 149.148 |
| 3 | 02620045 | 0.404405 | 0.000600994 | 89.7759 | 02620044 | 0.0118602 | 0.393146 | 97.2141 |