| Red | Green | Blue | |
| z | 17.63 | ||
| znorm | Inf | ||
| sky | -NaN | -NaN | -Inf |
| S/N | 23.8 | 42.1 | 45.3 |
| S/N(c) | 0.0 | 0.0 | 0.0 |
| SN(E/C) |
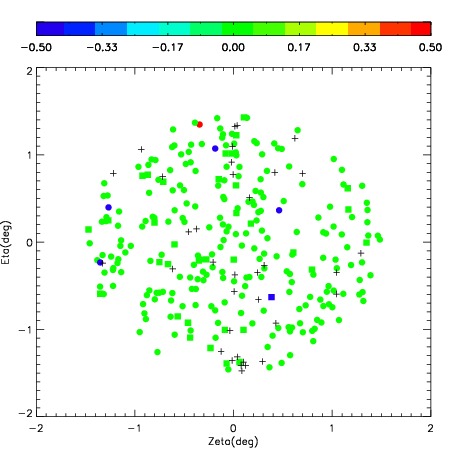

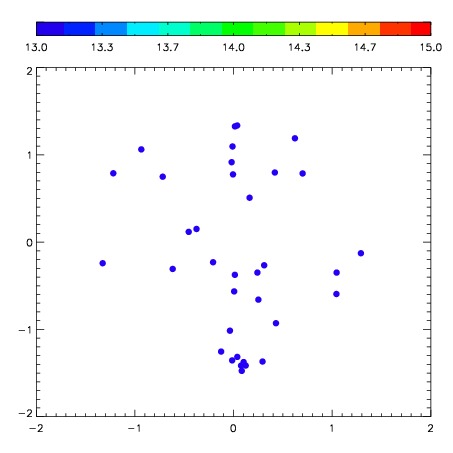
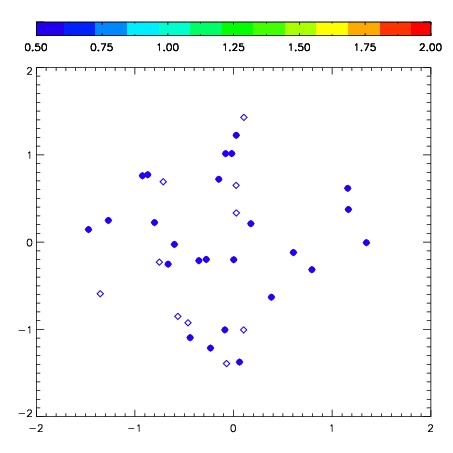
| Frame | Nreads | Zeropoints | Mag plots | Spatial mag deviation | Spatial sky 16325A emission deviations (filled: sky, open: star) | Spatial sky continuum emission | Spatial sky telluric CO2 absorption deviations (filled: H < 10) | |||||||||||||||||||||||
| 0 | 0 |
|
|
|
|
|
|
| IPAIR | NAME | SHIFT | NEWSHIFT | S/N | NAME | SHIFT | NEWSHIFT | S/N |
| 0 | 02780056 | 0.337273 | 0.00000 | 237.089 | 02780055 | -0.0156304 | 0.352903 | 236.572 |
| 1 | 02780057 | 0.335677 | 0.00159600 | 242.080 | 02780054 | -0.00389907 | 0.341172 | 237.672 |
| 2 | 02780053 | 0.330718 | 0.00655499 | 233.264 | 02780058 | -0.00878297 | 0.346056 | 232.025 |
| 3 | 02780061 | 0.331328 | 0.00594500 | 225.533 | 02780062 | -0.00529650 | 0.342570 | 215.139 |
| 4 | 02780052 | 0.333409 | 0.00386399 | 223.982 | 02780059 | -0.0130221 | 0.350295 | 214.652 |
| 5 | 02780060 | 0.328307 | 0.00896600 | 220.747 | 02780051 | 0.00000 | 0.337273 | 153.454 |