| Red | Green | Blue | |
| z | 17.64 | ||
| znorm | Inf | ||
| sky | -Inf | -Inf | -Inf |
| S/N | 34.3 | 49.7 | 52.9 |
| S/N(c) | 0.0 | 0.0 | 0.0 |
| SN(E/C) |

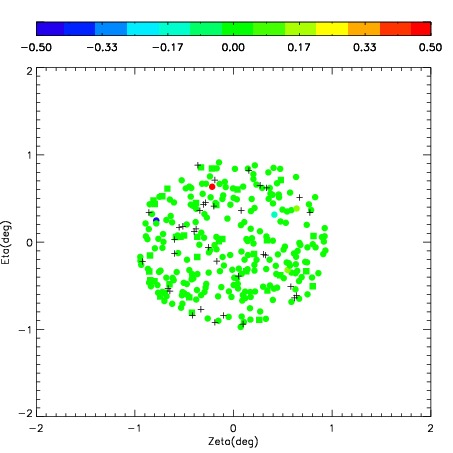

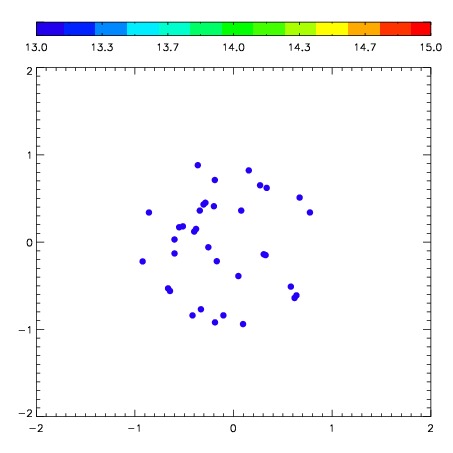
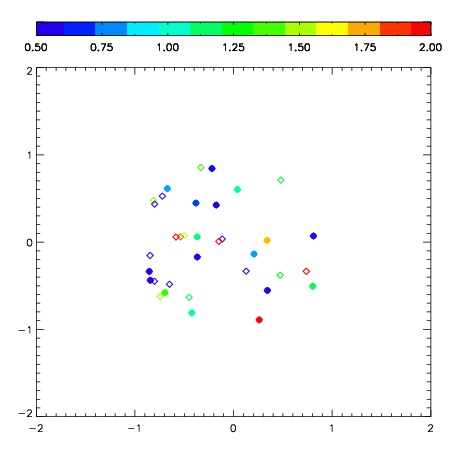
| Frame | Nreads | Zeropoints | Mag plots | Spatial mag deviation | Spatial sky 16325A emission deviations (filled: sky, open: star) | Spatial sky continuum emission | Spatial sky telluric CO2 absorption deviations (filled: H < 10) | |||||||||||||||||||||||
| 0 | 0 |
|
|
|
|
|
|
| 01970032 | 0.00000 | 254.135 |
| 01970033 | 0.00000 | 265.474 |
| 01970034 | 0.00000 | 251.293 |
| 01970035 | 0.00000 | 268.238 |
| 01970036 | 0.00000 | 253.687 |
| 01970037 | 0.00000 | 195.749 |
| 01970038 | 0.00000 | 257.243 |