| Red | Green | Blue | |
| z | 17.64 | ||
| znorm | Inf | ||
| sky | -Inf | -Inf | -Inf |
| S/N | 31.7 | 53.9 | 63.7 |
| S/N(c) | 0.0 | 0.0 | 0.0 |
| SN(E/C) |


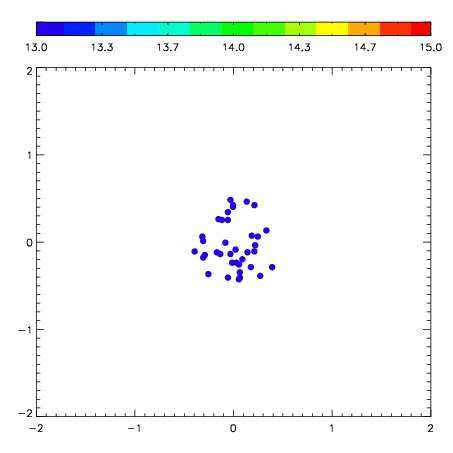
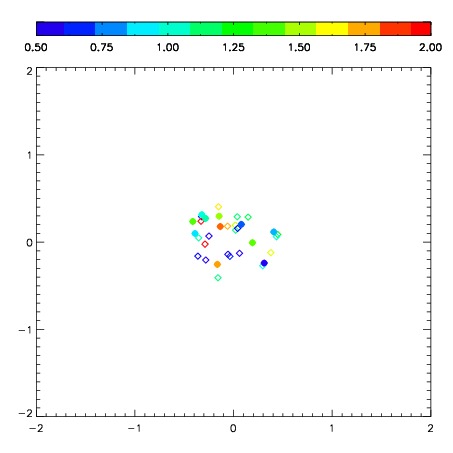
| Frame | Nreads | Zeropoints | Mag plots | Spatial mag deviation | Spatial sky 16325A emission deviations (filled: sky, open: star) | Spatial sky continuum emission | Spatial sky telluric CO2 absorption deviations (filled: H < 10) | |||||||||||||||||||||||
| 0 | 0 |
|
|
|
|
|
|
| 01980030 | 0.00000 | 169.912 |
| 01980031 | 0.00000 | 180.715 |
| 01980032 | 0.00000 | 186.251 |
| 01980033 | 0.00000 | 159.292 |
| 01980034 | 0.00000 | 162.871 |
| 01980035 | 0.00000 | 173.718 |
| 01980036 | 0.00000 | 190.064 |
| 01980037 | 0.00000 | 179.504 |
| 01980038 | 0.00000 | 184.405 |