| Red | Green | Blue | |
| z | 17.64 | ||
| znorm | Inf | ||
| sky | -Inf | -Inf | -Inf |
| S/N | 33.7 | 51.7 | 56.6 |
| S/N(c) | 0.0 | 0.0 | 0.0 |
| SN(E/C) |

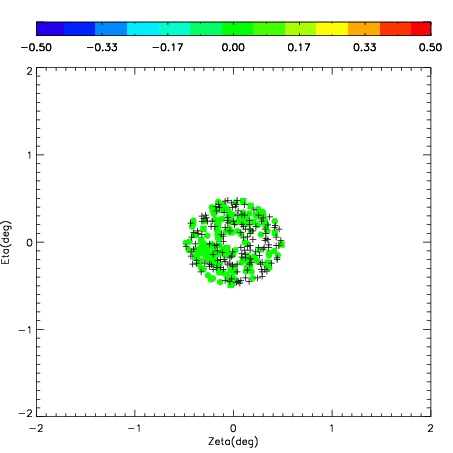


| Frame | Nreads | Zeropoints | Mag plots | Spatial mag deviation | Spatial sky 16325A emission deviations (filled: sky, open: star) | Spatial sky continuum emission | Spatial sky telluric CO2 absorption deviations (filled: H < 10) | |||||||||||||||||||||||
| 0 | 0 |
|
|
|
|
|
|
| 01980009 | 0.00000 | 202.691 |
| 01980010 | 0.00000 | 223.118 |
| 01980011 | 0.00000 | 200.214 |
| 01980012 | 0.00000 | 205.907 |
| 01980013 | 0.00000 | 200.853 |
| 01980014 | 0.00000 | 194.791 |
| 01980015 | 0.00000 | 210.232 |