| Red | Green | Blue | |
| z | 17.64 | ||
| znorm | Inf | ||
| sky | -NaN | -NaN | -Inf |
| S/N | 41.7 | 61.8 | 68.7 |
| S/N(c) | 0.0 | 0.0 | 0.0 |
| SN(E/C) |

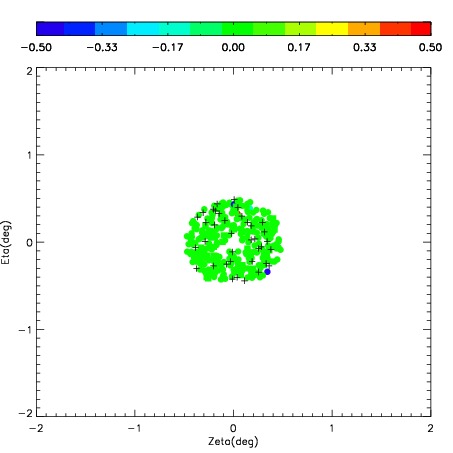
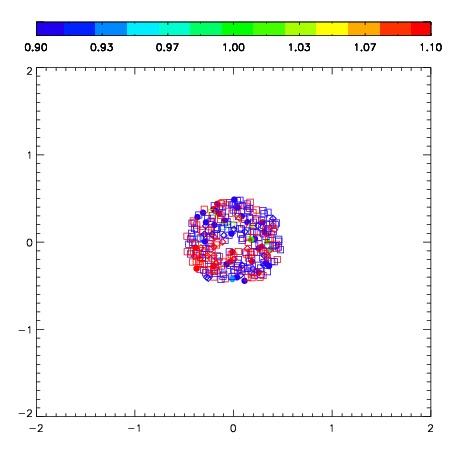
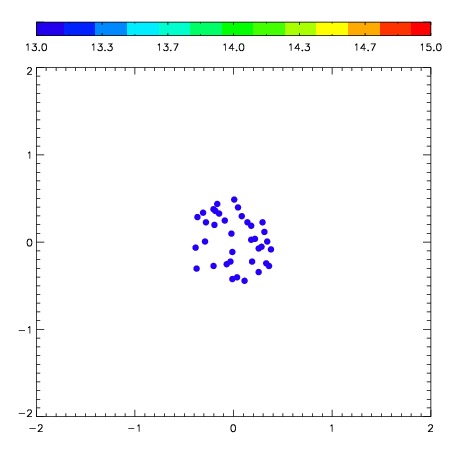

| Frame | Nreads | Zeropoints | Mag plots | Spatial mag deviation | Spatial sky 16325A emission deviations (filled: sky, open: star) | Spatial sky continuum emission | Spatial sky telluric CO2 absorption deviations (filled: H < 10) | |||||||||||||||||||||||
| 0 | 0 |
|
|
|
|
|
|
| 01900073 | 0.00000 | 247.971 |
| 01900074 | 0.00000 | 252.572 |
| 01900075 | 0.00000 | 248.617 |
| 01900076 | 0.00000 | 256.300 |
| 01900077 | 0.00000 | 257.155 |
| 01900078 | 0.00000 | 243.237 |
| 01900079 | 0.00000 | 246.720 |