| Red | Green | Blue | |
| z | 17.64 | ||
| znorm | Inf | ||
| sky | -Inf | -Inf | -Inf |
| S/N | 22.3 | 37.0 | 39.8 |
| S/N(c) | 0.0 | 0.0 | 0.0 |
| SN(E/C) |


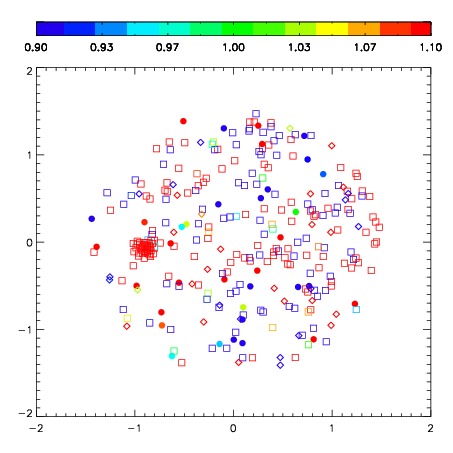


| Frame | Nreads | Zeropoints | Mag plots | Spatial mag deviation | Spatial sky 16325A emission deviations (filled: sky, open: star) | Spatial sky continuum emission | Spatial sky telluric CO2 absorption deviations (filled: H < 10) | |||||||||||||||||||||||
| 0 | 0 |
|
|
|
|
|
|
| IPAIR | NAME | SHIFT | NEWSHIFT | S/N | NAME | SHIFT | NEWSHIFT | S/N |
| 0 | 02780020 | 0.278449 | 0.00000 | 213.897 | 02780021 | -0.0221326 | 0.300582 | 214.877 |
| 1 | 02780015 | 0.275144 | 0.00330499 | 243.788 | 02780017 | -0.0220793 | 0.300528 | 240.282 |
| 2 | 02780016 | 0.273813 | 0.00463599 | 231.350 | 02780014 | 0.00000 | 0.278449 | 240.011 |
| 3 | 02780019 | 0.270822 | 0.00762701 | 222.815 | 02780018 | -0.0265817 | 0.305031 | 238.505 |