| Red | Green | Blue | |
| z | 17.64 | ||
| znorm | Inf | ||
| sky | -Inf | -Inf | -Inf |
| S/N | 24.5 | 39.1 | 41.5 |
| S/N(c) | 0.0 | 0.0 | 0.0 |
| SN(E/C) |


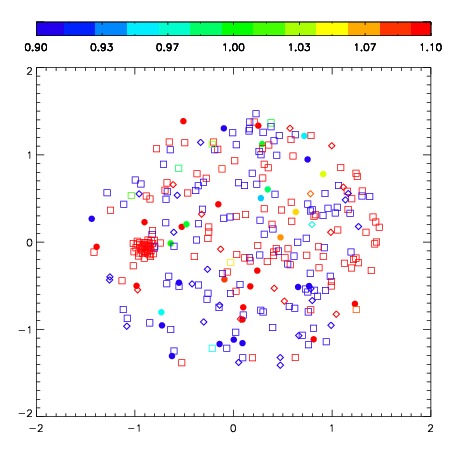


| Frame | Nreads | Zeropoints | Mag plots | Spatial mag deviation | Spatial sky 16325A emission deviations (filled: sky, open: star) | Spatial sky continuum emission | Spatial sky telluric CO2 absorption deviations (filled: H < 10) | |||||||||||||||||||||||
| 0 | 0 |
|
|
|
|
|
|
| IPAIR | NAME | SHIFT | NEWSHIFT | S/N | NAME | SHIFT | NEWSHIFT | S/N |
| 0 | 02890011 | 0.215472 | 0.00000 | 240.303 | 02890010 | 0.00000 | 0.215472 | 242.254 |
| 1 | 02890012 | 0.214264 | 0.00120799 | 245.470 | 02890014 | -0.0418725 | 0.257344 | 243.043 |
| 2 | 02890015 | 0.206262 | 0.00920999 | 240.836 | 02890017 | -0.0418516 | 0.257324 | 242.384 |
| 3 | 02890016 | 0.206230 | 0.00924200 | 239.852 | 02890013 | -0.0394095 | 0.254882 | 240.733 |
| 4 | 02890019 | 0.213761 | 0.00171100 | 236.107 | 02890018 | -0.0431433 | 0.258615 | 237.692 |