| Red | Green | Blue | |
| z | 17.64 | ||
| znorm | Inf | ||
| sky | -NaN | -NaN | -Inf |
| S/N | 15.4 | 27.7 | 30.0 |
| S/N(c) | 0.0 | 0.0 | 0.0 |
| SN(E/C) |

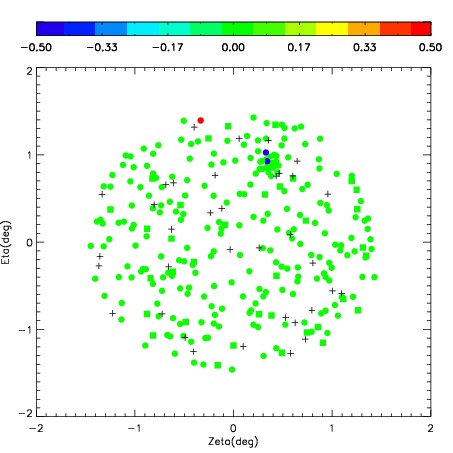

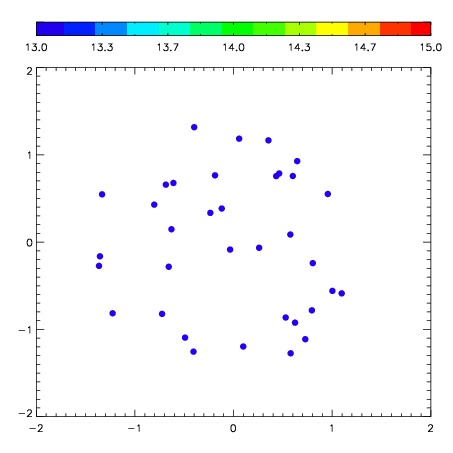
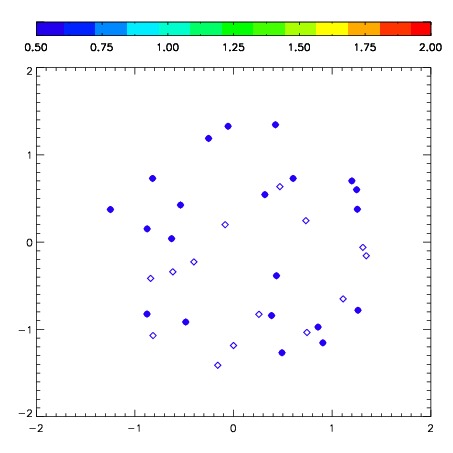
| Frame | Nreads | Zeropoints | Mag plots | Spatial mag deviation | Spatial sky 16325A emission deviations (filled: sky, open: star) | Spatial sky continuum emission | Spatial sky telluric CO2 absorption deviations (filled: H < 10) | |||||||||||||||||||||||
| 0 | 0 |
|
|
|
|
|
|
| IPAIR | NAME | SHIFT | NEWSHIFT | S/N | NAME | SHIFT | NEWSHIFT | S/N |
| 0 | 02510016 | 0.306973 | 0.00000 | 42.6569 | 02510022 | -0.0556615 | 0.362635 | 0.00000 |
| 1 | 02510012 | 0.205194 | 0.101779 | 272.476 | 02510014 | -0.0377040 | 0.344677 | 267.543 |
| 2 | 02510013 | 0.210619 | 0.0963540 | 257.918 | 02510015 | -0.0374172 | 0.344390 | 263.774 |
| 3 | 02510020 | 0.261047 | 0.0459260 | 206.010 | 02510011 | 0.00000 | 0.306973 | 255.142 |
| 4 | 02510021 | 0.267190 | 0.0397830 | 163.657 | 02510018 | -0.0419947 | 0.348968 | 236.819 |
| 5 | 02510017 | 0.290698 | 0.0162750 | 120.913 | 02510019 | -0.0536016 | 0.360575 | 60.0684 |