| Red | Green | Blue | |
| z | 17.64 | ||
| znorm | Inf | ||
| sky | -Inf | -Inf | -Inf |
| S/N | 23.5 | 38.3 | 40.8 |
| S/N(c) | 0.0 | 0.0 | 0.0 |
| SN(E/C) |
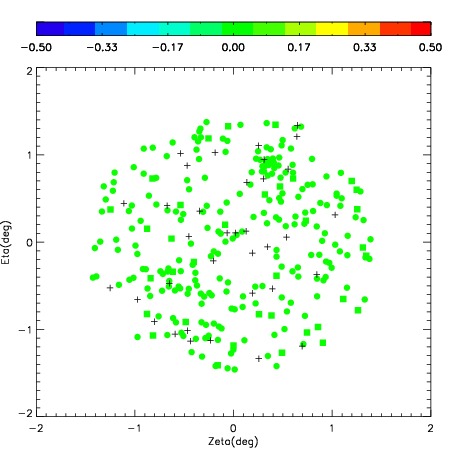
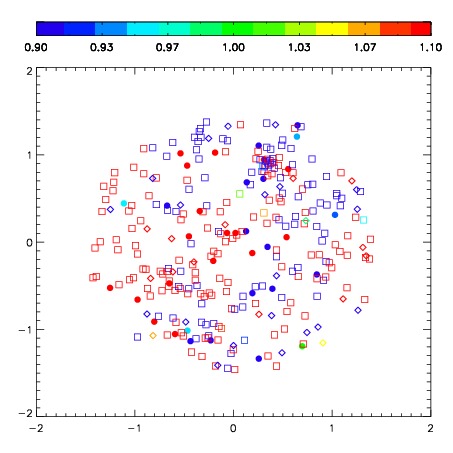


| Frame | Nreads | Zeropoints | Mag plots | Spatial mag deviation | Spatial sky 16325A emission deviations (filled: sky, open: star) | Spatial sky continuum emission | Spatial sky telluric CO2 absorption deviations (filled: H < 10) | |||||||||||||||||||||||
| 0 | 0 |
|
|
|
|
|
|
| IPAIR | NAME | SHIFT | NEWSHIFT | S/N | NAME | SHIFT | NEWSHIFT | S/N |
| 0 | 02610019 | 0.286921 | 0.00000 | 222.788 | 02610017 | -0.0218211 | 0.308742 | 224.967 |
| 1 | 02610018 | 0.279435 | 0.00748599 | 208.675 | 02610020 | -0.0230667 | 0.309988 | 214.661 |
| 2 | 02610015 | 0.275340 | 0.0115810 | 207.815 | 02610016 | -0.0208931 | 0.307814 | 214.558 |
| 3 | 02610014 | 0.279283 | 0.00763801 | 204.447 | 02610013 | 0.00000 | 0.286921 | 210.979 |