| Red | Green | Blue | |
| z | 17.64 | ||
| znorm | Inf | ||
| sky | -Inf | -Inf | -Inf |
| S/N | 17.4 | 30.7 | 34.5 |
| S/N(c) | 0.0 | 0.0 | 0.0 |
| SN(E/C) |


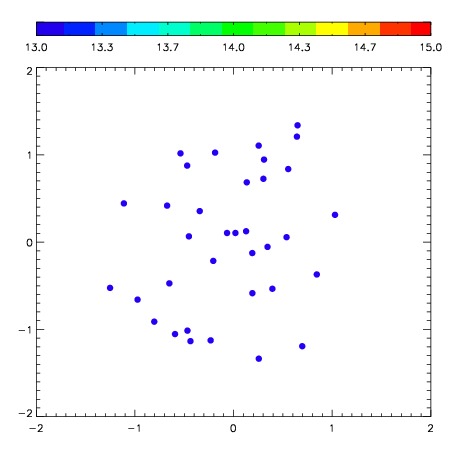

| Frame | Nreads | Zeropoints | Mag plots | Spatial mag deviation | Spatial sky 16325A emission deviations (filled: sky, open: star) | Spatial sky continuum emission | Spatial sky telluric CO2 absorption deviations (filled: H < 10) | |||||||||||||||||||||||
| 0 | 0 |
|
|
|
|
|
|
| IPAIR | NAME | SHIFT | NEWSHIFT | S/N | NAME | SHIFT | NEWSHIFT | S/N |
| 0 | 02780031 | 0.339782 | 0.00000 | 147.638 | 02780036 | -0.00809090 | 0.347873 | 139.506 |
| 1 | 02780034 | 0.332216 | 0.00756600 | 191.998 | 02780032 | -0.00859110 | 0.348373 | 168.440 |
| 2 | 02780035 | 0.330606 | 0.00917599 | 190.608 | 02780029 | 0.00000 | 0.339782 | 160.408 |
| 3 | 02780030 | 0.336077 | 0.00370499 | 151.602 | 02780033 | -0.0144573 | 0.354239 | 157.396 |