| Red | Green | Blue | |
| z | 17.64 | ||
| znorm | Inf | ||
| sky | -NaN | -Inf | -Inf |
| S/N | 25.8 | 44.6 | 47.0 |
| S/N(c) | 0.0 | 0.0 | 0.0 |
| SN(E/C) |

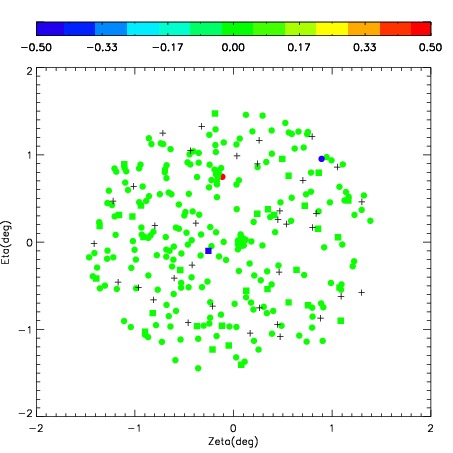
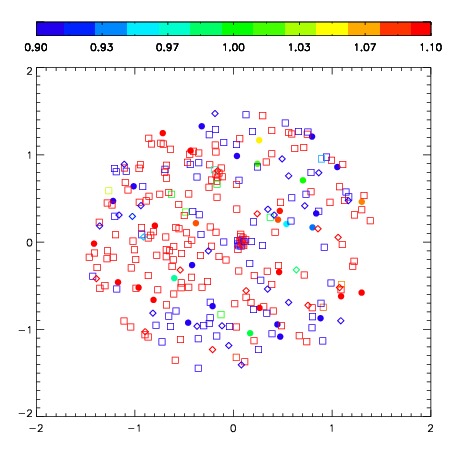

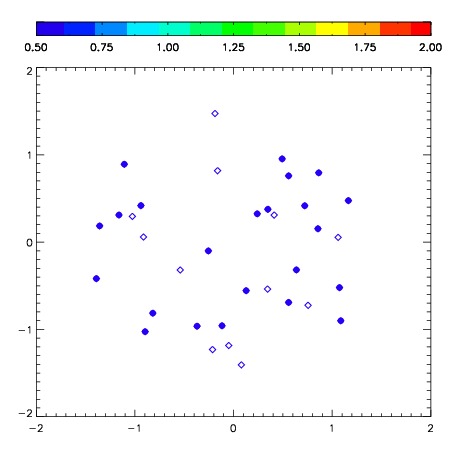
| Frame | Nreads | Zeropoints | Mag plots | Spatial mag deviation | Spatial sky 16325A emission deviations (filled: sky, open: star) | Spatial sky continuum emission | Spatial sky telluric CO2 absorption deviations (filled: H < 10) | |||||||||||||||||||||||
| 0 | 0 |
|
|
|
|
|
|
| IPAIR | NAME | SHIFT | NEWSHIFT | S/N | NAME | SHIFT | NEWSHIFT | S/N |
| 0 | 05470052 | 0.403831 | 0.00000 | 279.804 | 05470050 | -0.0105892 | 0.414420 | 277.570 |
| 1 | 05470053 | 0.403268 | 0.000562996 | 282.864 | 05470054 | -0.00803070 | 0.411862 | 286.104 |
| 2 | 05470049 | 0.401957 | 0.00187400 | 281.674 | 05470047 | 0.00000 | 0.403831 | 279.614 |
| 3 | 05470048 | 0.398502 | 0.00532901 | 280.217 | 05470051 | -0.00792068 | 0.411752 | 277.990 |