| Red | Green | Blue | |
| z | 17.64 | ||
| znorm | Inf | ||
| sky | -Inf | -Inf | -Inf |
| S/N | 30.0 | 50.8 | 55.3 |
| S/N(c) | 0.0 | 0.0 | 0.0 |
| SN(E/C) |

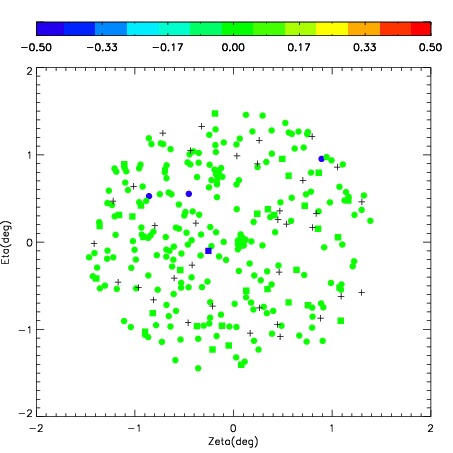
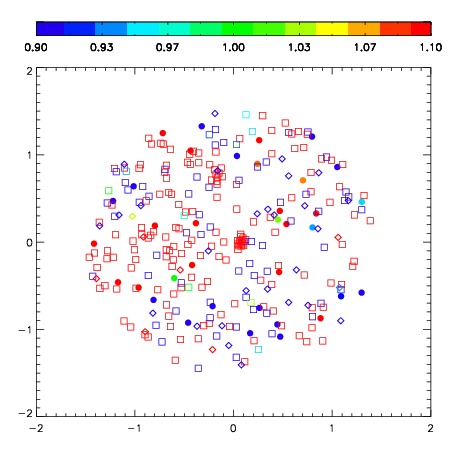
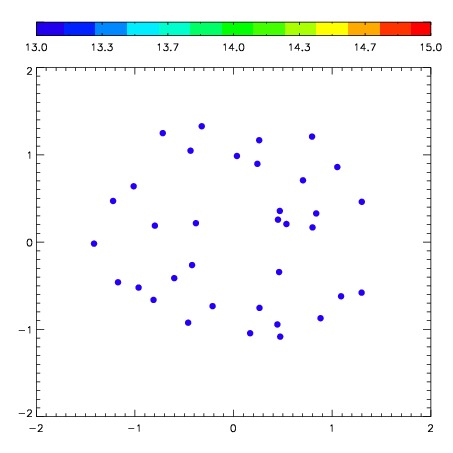
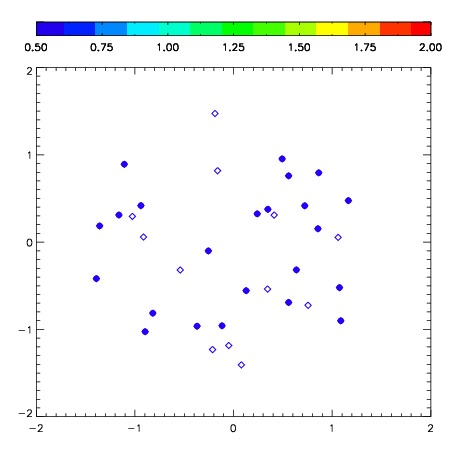
| Frame | Nreads | Zeropoints | Mag plots | Spatial mag deviation | Spatial sky 16325A emission deviations (filled: sky, open: star) | Spatial sky continuum emission | Spatial sky telluric CO2 absorption deviations (filled: H < 10) | |||||||||||||||||||||||
| 0 | 0 |
|
|
|
|
|
|
| IPAIR | NAME | SHIFT | NEWSHIFT | S/N | NAME | SHIFT | NEWSHIFT | S/N |
| 0 | 06020031 | 0.470915 | 0.00000 | 240.502 | 06020029 | 0.0330887 | 0.437826 | 248.164 |
| 1 | 06020035 | 0.469213 | 0.00170198 | 254.529 | 06020030 | 0.0306848 | 0.440230 | 256.695 |
| 2 | 06020027 | 0.470461 | 0.000453979 | 243.127 | 06020033 | 0.0301679 | 0.440747 | 255.284 |
| 3 | 06020032 | 0.469728 | 0.00118700 | 241.943 | 06020034 | 0.0297499 | 0.441165 | 250.120 |
| 4 | 06020028 | 0.469086 | 0.00182900 | 235.749 | 06020026 | 0.00000 | 0.470915 | 243.104 |