| Red | Green | Blue | |
| z | 17.64 | ||
| znorm | Inf | ||
| sky | -Inf | -NaN | -Inf |
| S/N | 24.5 | 42.3 | 45.6 |
| S/N(c) | 0.0 | 0.0 | 0.0 |
| SN(E/C) |
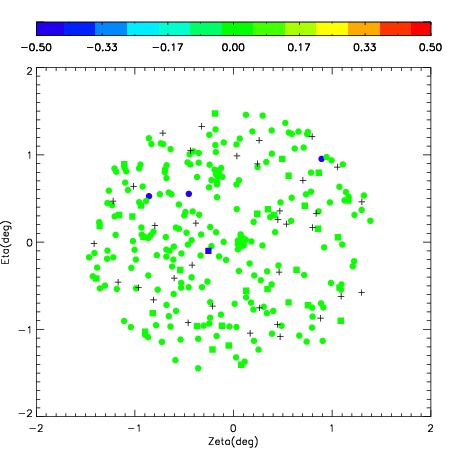
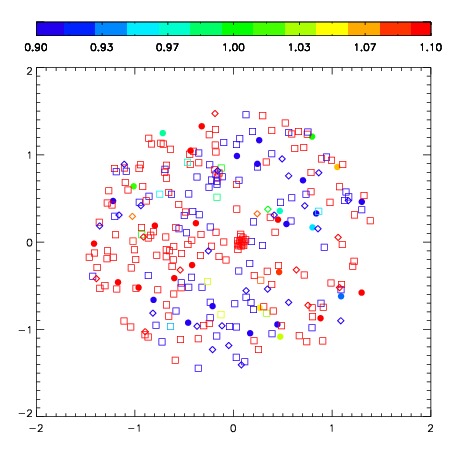
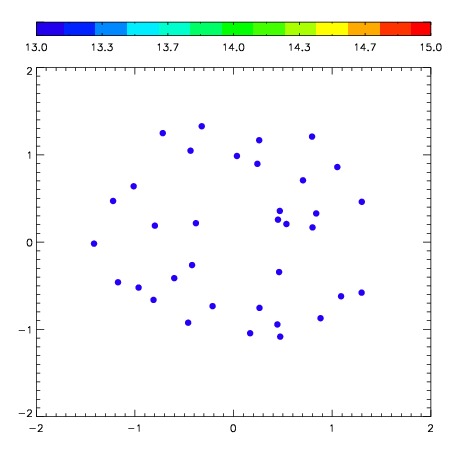
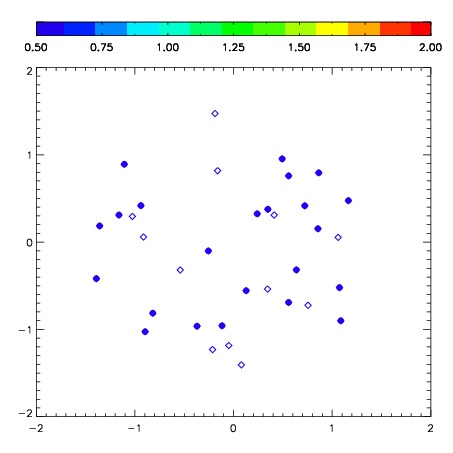
| Frame | Nreads | Zeropoints | Mag plots | Spatial mag deviation | Spatial sky 16325A emission deviations (filled: sky, open: star) | Spatial sky continuum emission | Spatial sky telluric CO2 absorption deviations (filled: H < 10) | |||||||||||||||||||||||
| 0 | 0 |
|
|
|
|
|
|
| IPAIR | NAME | SHIFT | NEWSHIFT | S/N | NAME | SHIFT | NEWSHIFT | S/N |
| 0 | 06070031 | 0.492459 | 0.00000 | 267.435 | 06070032 | 0.0483972 | 0.444062 | 281.008 |
| 1 | 06070030 | 0.490426 | 0.00203300 | 262.550 | 06070029 | 0.0475385 | 0.444921 | 257.886 |
| 2 | 06070027 | 0.488610 | 0.00384900 | 253.488 | 06070028 | 0.0513488 | 0.441110 | 252.412 |
| 3 | 06070026 | 0.485815 | 0.00664401 | 251.428 | 06070025 | 0.00000 | 0.492459 | 249.343 |