| Red | Green | Blue | |
| z | 17.64 | ||
| znorm | Inf | ||
| sky | -NaN | -NaN | -Inf |
| S/N | 19.8 | 35.6 | 37.5 |
| S/N(c) | 0.0 | 0.0 | 0.0 |
| SN(E/C) |


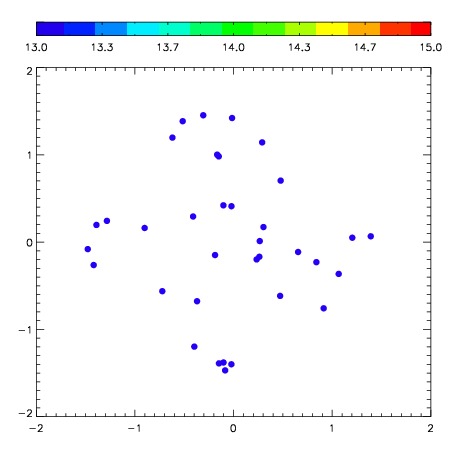
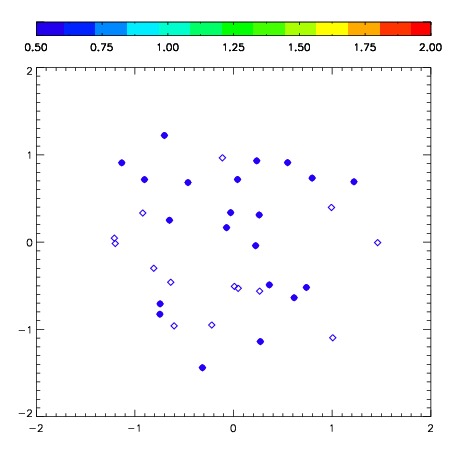
| Frame | Nreads | Zeropoints | Mag plots | Spatial mag deviation | Spatial sky 16325A emission deviations (filled: sky, open: star) | Spatial sky continuum emission | Spatial sky telluric CO2 absorption deviations (filled: H < 10) | |||||||||||||||||||||||
| 0 | 0 |
|
|
|
|
|
|
| IPAIR | NAME | SHIFT | NEWSHIFT | S/N | NAME | SHIFT | NEWSHIFT | S/N |
| 0 | 02590031 | 0.351843 | 0.00000 | 247.601 | 02590033 | 0.0174780 | 0.334365 | 232.043 |
| 1 | 02590027 | 0.329495 | 0.0223480 | 302.282 | 02590026 | 0.00000 | 0.351843 | 314.681 |
| 2 | 02590028 | 0.336826 | 0.0150170 | 293.507 | 02590029 | 0.0158525 | 0.335990 | 298.088 |
| 3 | 02590032 | 0.348366 | 0.00347701 | 256.961 | 02590030 | 0.0126138 | 0.339229 | 282.108 |