| Red | Green | Blue | |
| z | 17.64 | ||
| znorm | Inf | ||
| sky | -Inf | -Inf | -Inf |
| S/N | 16.1 | 30.7 | 33.4 |
| S/N(c) | 0.0 | 0.0 | 0.0 |
| SN(E/C) |

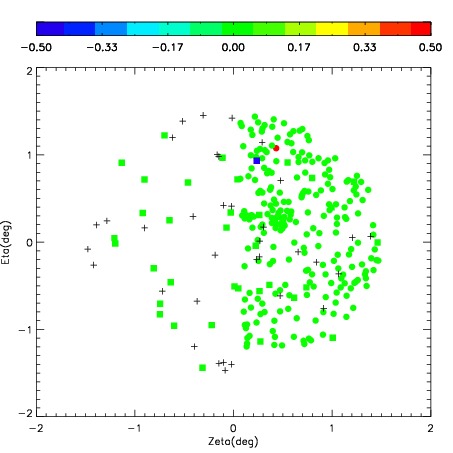
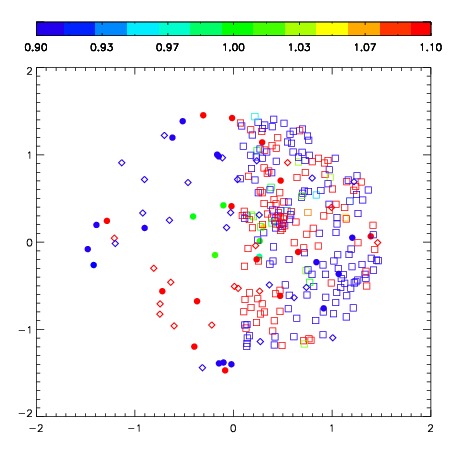
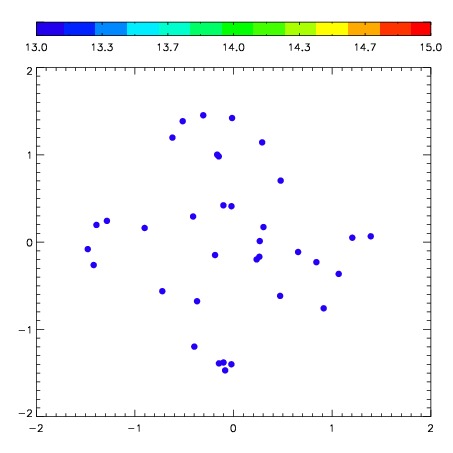
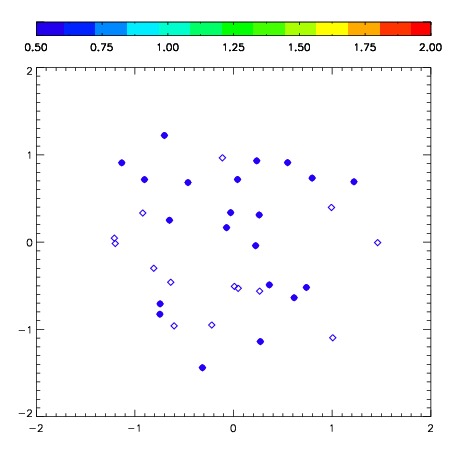
| Frame | Nreads | Zeropoints | Mag plots | Spatial mag deviation | Spatial sky 16325A emission deviations (filled: sky, open: star) | Spatial sky continuum emission | Spatial sky telluric CO2 absorption deviations (filled: H < 10) | |||||||||||||||||||||||
| 0 | 0 |
|
|
|
|
|
|
| IPAIR | NAME | SHIFT | NEWSHIFT | S/N | NAME | SHIFT | NEWSHIFT | S/N |
| 0 | 02620026 | 0.374184 | 0.00000 | 249.232 | 02620025 | 0.00000 | 0.374184 | 248.402 |
| 1 | 02620027 | 0.373838 | 0.000346005 | 230.139 | 02620029 | 0.0106313 | 0.363553 | 220.550 |
| 2 | 02620031 | 0.369461 | 0.00472301 | 203.606 | 02620028 | 0.0100827 | 0.364101 | 207.038 |
| 3 | 02620030 | 0.367929 | 0.00625500 | 197.554 | 02620032 | 0.0107587 | 0.363425 | 205.171 |