| Red | Green | Blue | |
| z | 17.64 | ||
| znorm | Inf | ||
| sky | -NaN | -NaN | -Inf |
| S/N | 18.2 | 33.6 | 33.6 |
| S/N(c) | 0.0 | 0.0 | 0.0 |
| SN(E/C) |


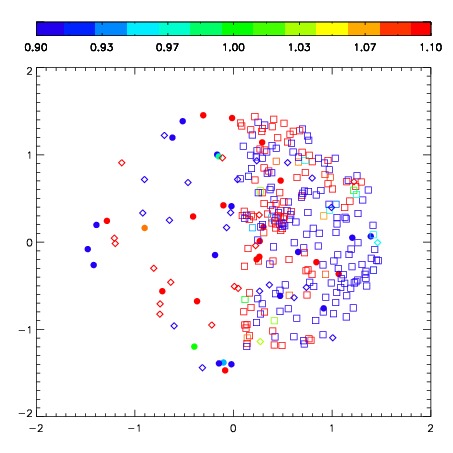
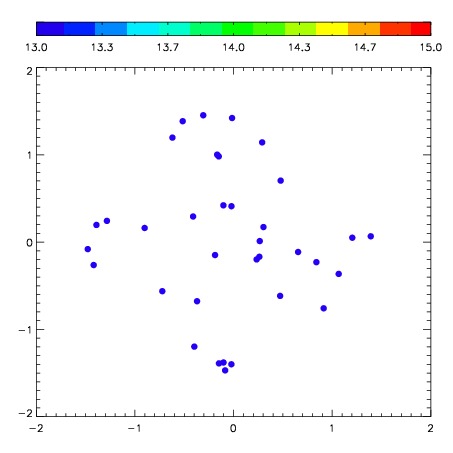
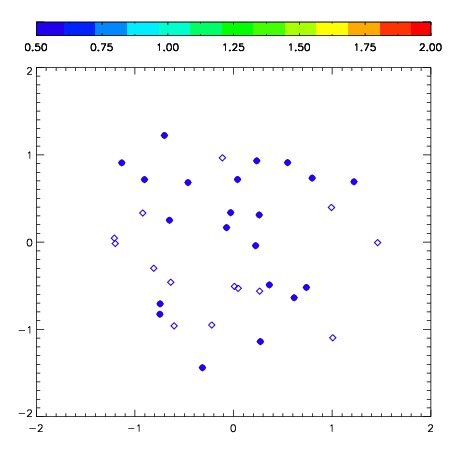
| Frame | Nreads | Zeropoints | Mag plots | Spatial mag deviation | Spatial sky 16325A emission deviations (filled: sky, open: star) | Spatial sky continuum emission | Spatial sky telluric CO2 absorption deviations (filled: H < 10) | |||||||||||||||||||||||
| 0 | 0 |
|
|
|
|
|
|
| IPAIR | NAME | SHIFT | NEWSHIFT | S/N | NAME | SHIFT | NEWSHIFT | S/N |
| 0 | 02810010 | 0.425570 | 0.00000 | 263.711 | 02810008 | 0.00000 | 0.425570 | 262.166 |
| 1 | 02810009 | 0.421980 | 0.00359002 | 250.745 | 02810011 | 0.0278573 | 0.397713 | 249.620 |
| 2 | 02810013 | 0.418642 | 0.00692800 | 246.940 | 02810015 | 0.0286691 | 0.396901 | 240.146 |
| 3 | 02810014 | 0.418710 | 0.00686002 | 241.635 | 02810012 | 0.0300303 | 0.395540 | 239.100 |