| Red | Green | Blue | |
| z | 17.64 | ||
| znorm | Inf | ||
| sky | -NaN | -NaN | -Inf |
| S/N | 23.1 | 40.0 | 44.7 |
| S/N(c) | 0.0 | 0.0 | 0.0 |
| SN(E/C) |

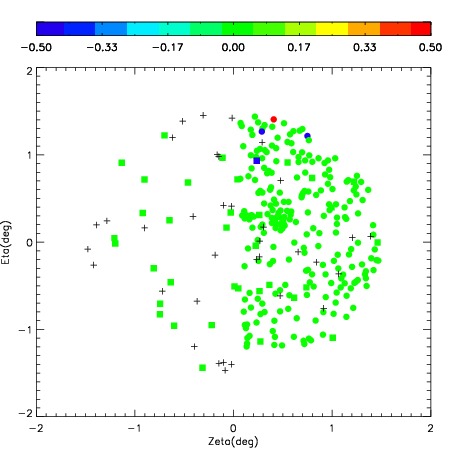
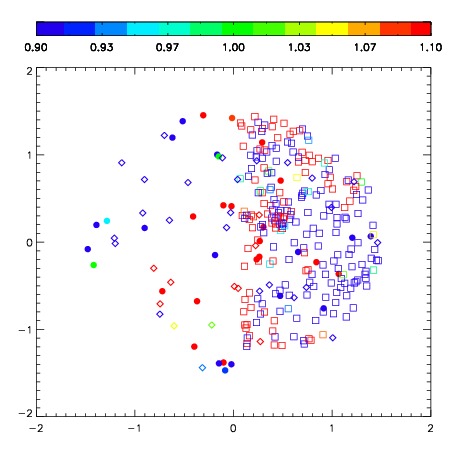

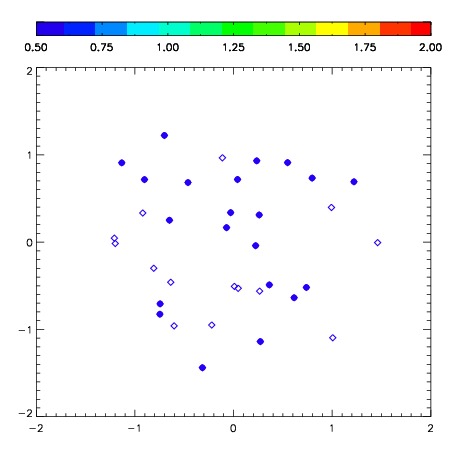
| Frame | Nreads | Zeropoints | Mag plots | Spatial mag deviation | Spatial sky 16325A emission deviations (filled: sky, open: star) | Spatial sky continuum emission | Spatial sky telluric CO2 absorption deviations (filled: H < 10) | |||||||||||||||||||||||
| 0 | 0 |
|
|
|
|
|
|
| IPAIR | NAME | SHIFT | NEWSHIFT | S/N | NAME | SHIFT | NEWSHIFT | S/N |
| 0 | 02820037 | 0.368089 | 0.00000 | 305.821 | 02820038 | 0.0174818 | 0.350607 | 315.252 |
| 1 | 02820040 | 0.365625 | 0.00246400 | 305.487 | 02820039 | 0.0139814 | 0.354108 | 305.722 |
| 2 | 02820041 | 0.363187 | 0.00490201 | 300.811 | 02820042 | 0.0179900 | 0.350099 | 293.523 |
| 3 | 02820036 | 0.366002 | 0.00208700 | 294.911 | 02820035 | 0.00000 | 0.368089 | 278.741 |