| Red | Green | Blue | |
| z | 17.64 | ||
| znorm | Inf | ||
| sky | -Inf | -Inf | -Inf |
| S/N | 13.2 | 21.6 | 22.8 |
| S/N(c) | 0.0 | 0.0 | 0.0 |
| SN(E/C) |

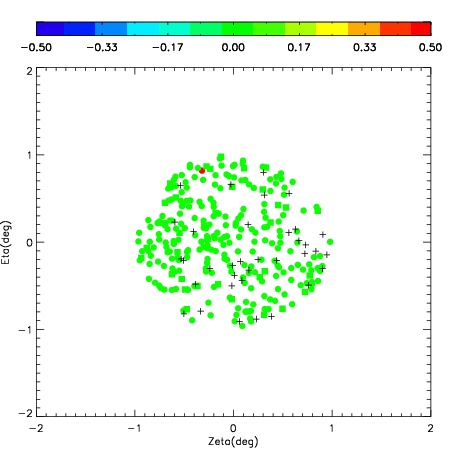
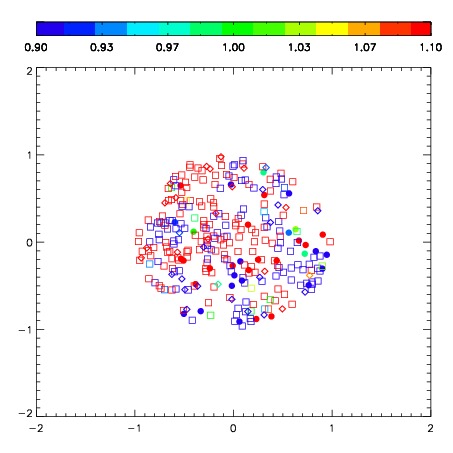


| Frame | Nreads | Zeropoints | Mag plots | Spatial mag deviation | Spatial sky 16325A emission deviations (filled: sky, open: star) | Spatial sky continuum emission | Spatial sky telluric CO2 absorption deviations (filled: H < 10) | |||||||||||||||||||||||
| 0 | 0 |
|
|
|
|
|
|
| IPAIR | NAME | SHIFT | NEWSHIFT | S/N | NAME | SHIFT | NEWSHIFT | S/N |
| 0 | 02480036 | 0.255644 | 0.00000 | 32.2961 | 02480035 | -0.109534 | 0.365178 | 127.466 |
| 1 | 02480032 | 0.243092 | 0.0125520 | 236.278 | 02480031 | 0.00000 | 0.255644 | 241.872 |
| 2 | 02480033 | 0.247531 | 0.00811300 | 215.929 | 02480034 | -0.0960289 | 0.351673 | 218.233 |