| Red | Green | Blue | |
| z | 17.64 | ||
| znorm | Inf | ||
| sky | -Inf | -Inf | -Inf |
| S/N | 13.6 | 25.4 | 28.5 |
| S/N(c) | 0.0 | 0.0 | 0.0 |
| SN(E/C) |

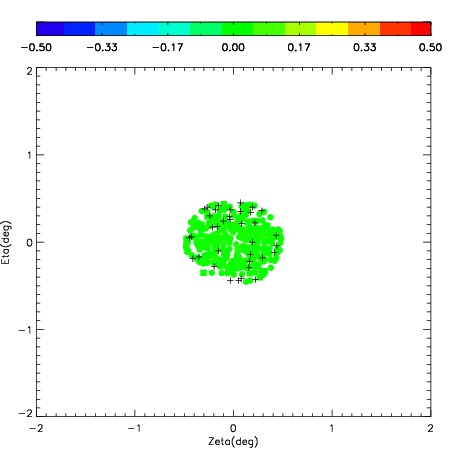
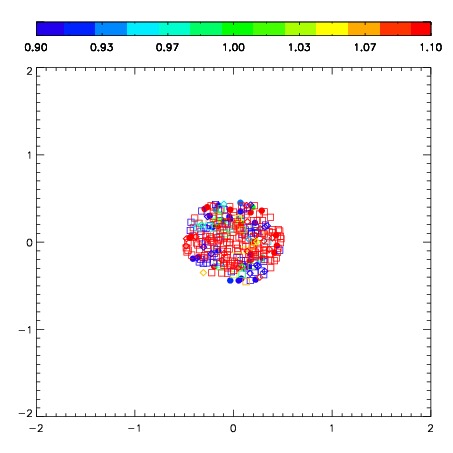
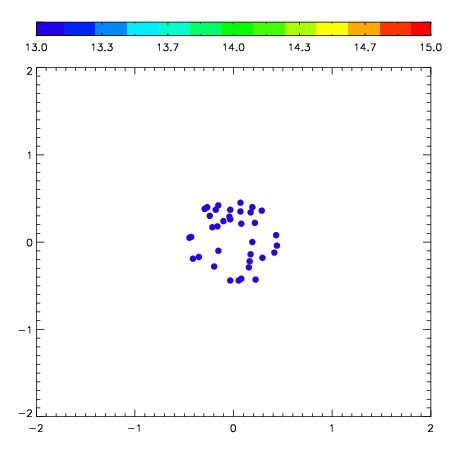

| Frame | Nreads | Zeropoints | Mag plots | Spatial mag deviation | Spatial sky 16325A emission deviations (filled: sky, open: star) | Spatial sky continuum emission | Spatial sky telluric CO2 absorption deviations (filled: H < 10) | |||||||||||||||||||||||
| 0 | 0 |
|
|
|
|
|
|
| IPAIR | NAME | SHIFT | NEWSHIFT | S/N | NAME | SHIFT | NEWSHIFT | S/N |
| 0 | 02540016 | 0.392939 | 0.00000 | 148.922 | 02540015 | -0.00110669 | 0.394046 | 171.742 |
| 1 | 02540017 | 0.387101 | 0.00583801 | 198.731 | 02540011 | 0.00000 | 0.392939 | 220.282 |
| 2 | 02540012 | 0.388039 | 0.00490001 | 194.026 | 02540018 | 0.00227684 | 0.390662 | 183.805 |
| 3 | 02540013 | 0.390824 | 0.00211501 | 187.162 | 02540014 | 0.000718072 | 0.392221 | 173.625 |