| Frame | Nreads | Zeropoints | Mag plots
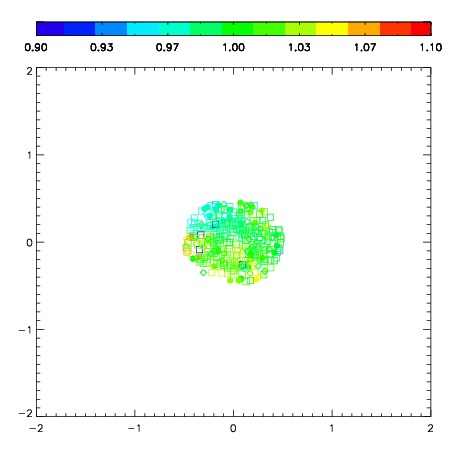
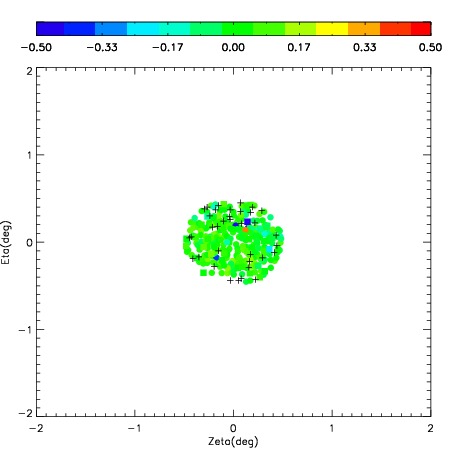
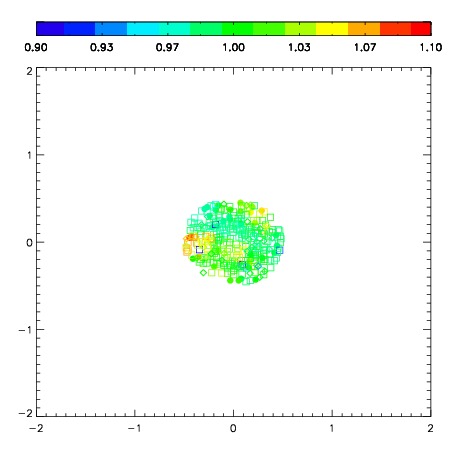
| Spatial mag deviation
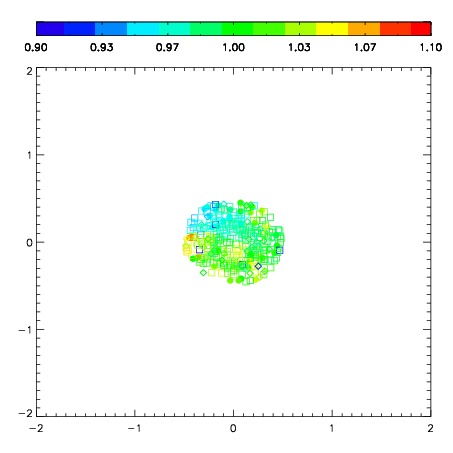
| Spatial sky 16325A emission deviations (filled: sky, open: star)
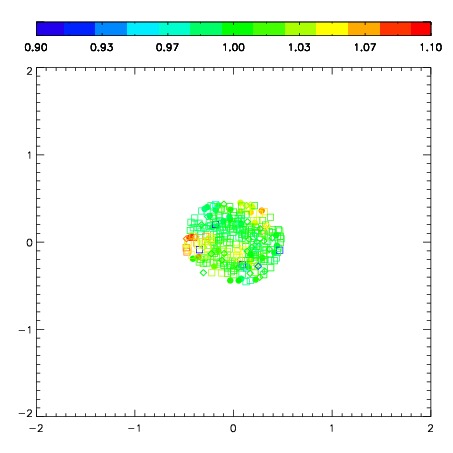
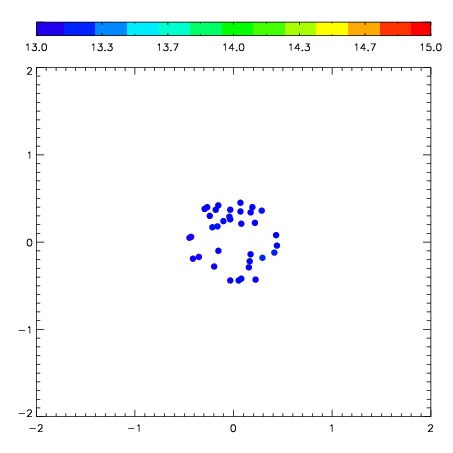
| Spatial sky continuum emission
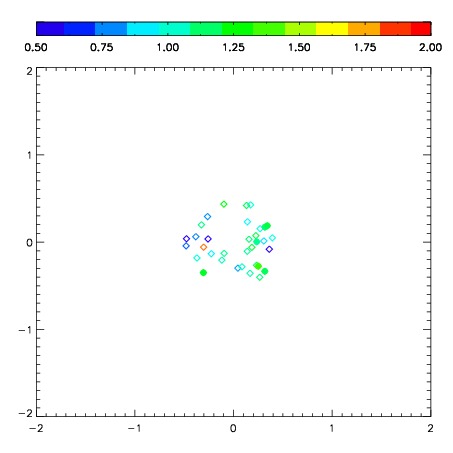
| Spatial sky telluric CO2 absorption deviations (filled: H < 10)
|
| 5210059
| 47
| | Red | Green | Blue
| | z | | 17.52
| | znorm | | 13.34
| | sky | 13.2 | 13.0 | 12.9
| | S/N | 4.6 | 7.9 | 8.7
| | S/N(c) | 4.1 | 7.1 | 7.6
| | SN(E/C) 0.78
|
| 
| 
| 
| 
| 
|
| 5210060
| 47
| | Red | Green | Blue
| | z | | 17.83
| | znorm | | 13.65
| | sky | 13.2 | 13.1 | 13.1
| | S/N | 5.7 | 9.7 | 10.8
| | S/N(c) | 5.0 | 8.9 | 9.5
| | SN(E/C) 0.71
|
| 
| 
| 
| 
| 
|
| 5210061
| 47
| | Red | Green | Blue
| | z | | 17.77
| | znorm | | 13.59
| | sky | 13.2 | 13.1 | 13.1
| | S/N | 5.4 | 9.5 | 10.5
| | S/N(c) | 4.8 | 8.5 | 9.2
| | SN(E/C) 0.77
|
| 
| 
| 
| 
| 
|
| 5210062
| 47
| | Red | Green | Blue
| | z | | 17.83
| | znorm | | 13.65
| | sky | 13.2 | 13.1 | 13.1
| | S/N | 5.8 | 9.9 | 10.8
| | S/N(c) | 4.9 | 8.7 | 9.4
| | SN(E/C) 0.71
|
| 
| 
| 
| 
| 
|
| 5210063
| 47
| | Red | Green | Blue
| | z | | 17.99
| | znorm | | 13.81
| | sky | 13.2 | 13.1 | 13.1
| | S/N | 6.7 | 11.0 | 12.1
| | S/N(c) | 5.8 | 9.8 | 10.7
| | SN(E/C) 0.67
|
| 
| 
| 
| 
| 
|
| 5210064
| 47
| | Red | Green | Blue
| | z | | 17.84
| | znorm | | 13.66
| | sky | 13.3 | 13.1 | 13.1
| | S/N | 5.7 | 9.9 | 10.9
| | S/N(c) | 4.9 | 8.7 | 9.5
| | SN(E/C) 0.72
|
| 
| 
| 
| 
| 
|
| 5210065
| 47
| | Red | Green | Blue
| | z | | 17.80
| | znorm | | 13.62
| | sky | 13.2 | 13.1 | 13.1
| | S/N | 5.6 | 9.4 | 10.6
| | S/N(c) | 4.8 | 8.4 | 9.3
| | SN(E/C) 0.76
|
| 
| 
| 
| 
| 
|
| 5210066
| 47
| | Red | Green | Blue
| | z | | 17.61
| | znorm | | 13.43
| | sky | 13.2 | 13.1 | 13.1
| | S/N | 4.7 | 8.3 | 8.9
| | S/N(c) | 4.1 | 7.2 | 7.8
| | SN(E/C) 0.77
|
| 
| 
| 
| 
| 
|

