| Red | Green | Blue | |
| z | 17.64 | ||
| znorm | Inf | ||
| sky | -Inf | -Inf | -Inf |
| S/N | 27.6 | 46.7 | 47.4 |
| S/N(c) | 0.0 | 0.0 | 0.0 |
| SN(E/C) |

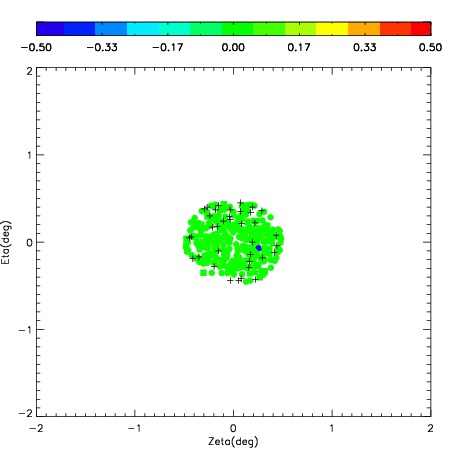
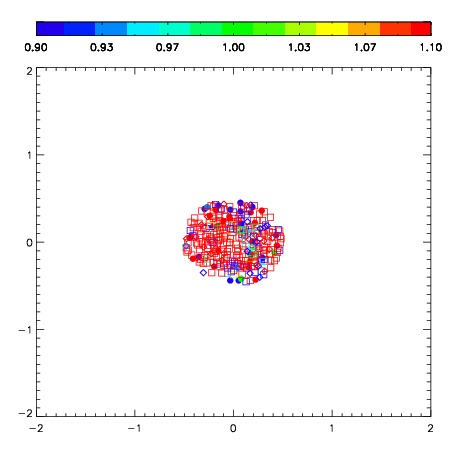
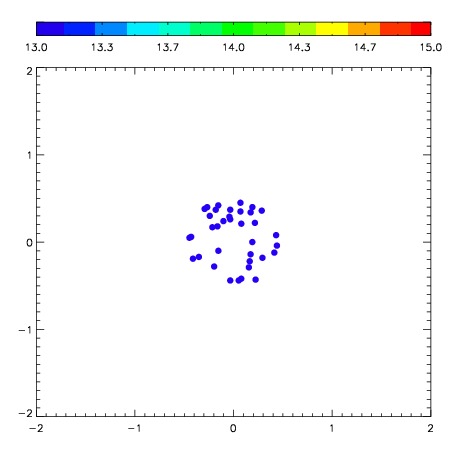
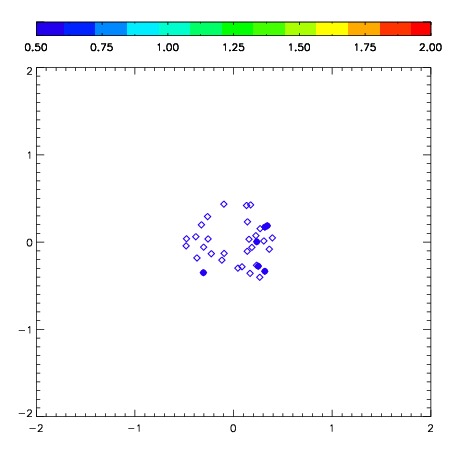
| Frame | Nreads | Zeropoints | Mag plots | Spatial mag deviation | Spatial sky 16325A emission deviations (filled: sky, open: star) | Spatial sky continuum emission | Spatial sky telluric CO2 absorption deviations (filled: H < 10) | |||||||||||||||||||||||
| 0 | 0 |
|
|
|
|
|
|
| IPAIR | NAME | SHIFT | NEWSHIFT | S/N | NAME | SHIFT | NEWSHIFT | S/N |
| 0 | 06110016 | 0.451071 | 0.00000 | 237.740 | 06110017 | 0.0108790 | 0.440192 | 236.661 |
| 1 | 06110015 | 0.450818 | 0.000252992 | 230.000 | 06110014 | 0.0126242 | 0.438447 | 231.413 |
| 2 | 06110012 | 0.450625 | 0.000445992 | 229.151 | 06110013 | 0.0107618 | 0.440309 | 230.130 |
| 3 | 06110011 | 0.450601 | 0.000469983 | 224.800 | 06110010 | 0.00000 | 0.451071 | 228.884 |