| Frame | Nreads | Zeropoints | Mag plots
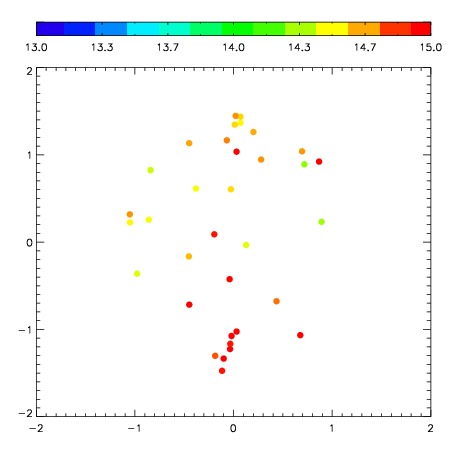
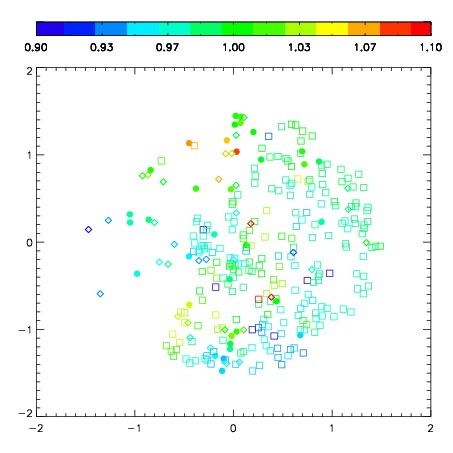
| Spatial mag deviation
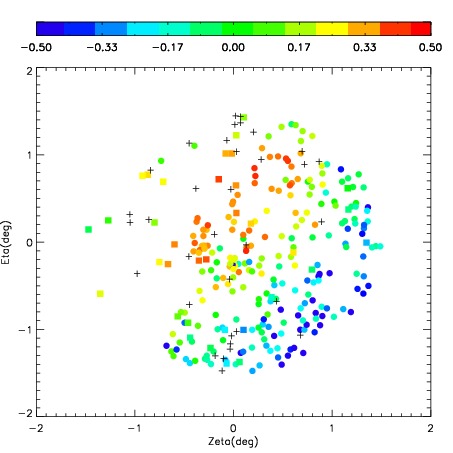
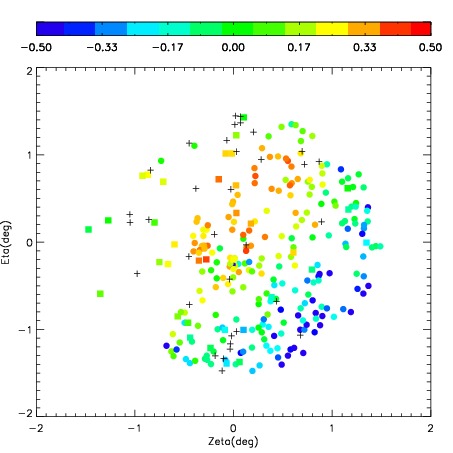
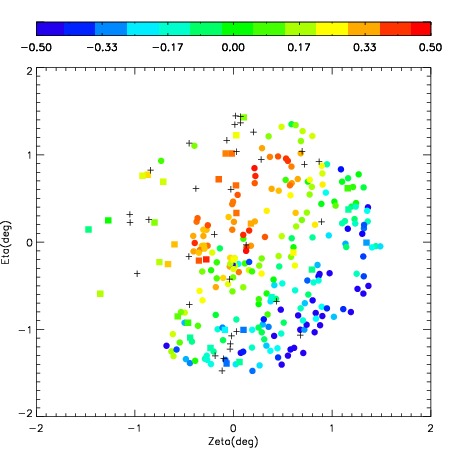
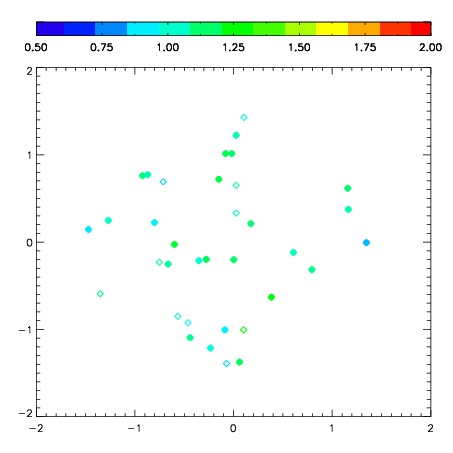
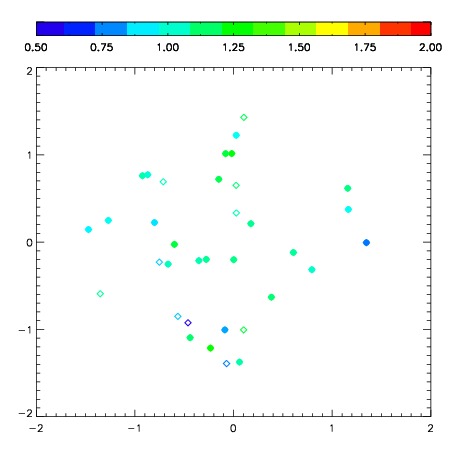
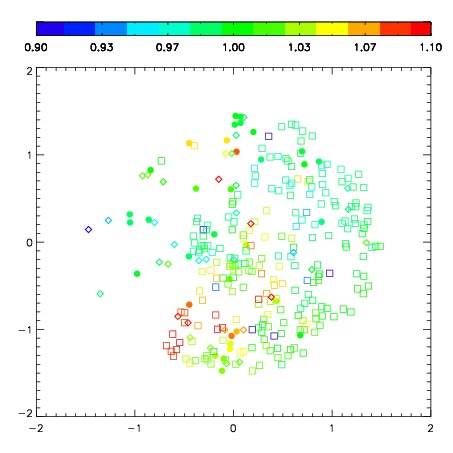
| Spatial sky 16325A emission deviations (filled: sky, open: star)
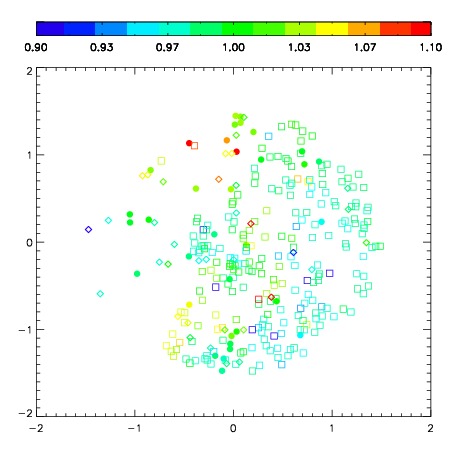
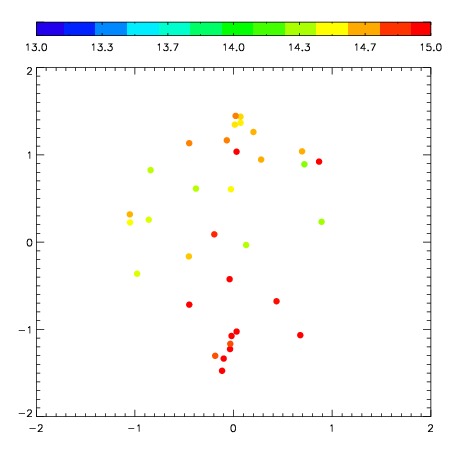
| Spatial sky continuum emission
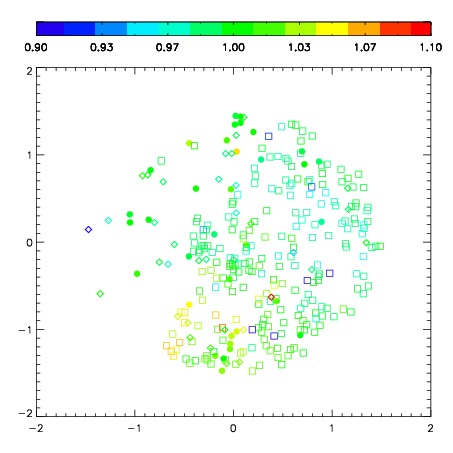
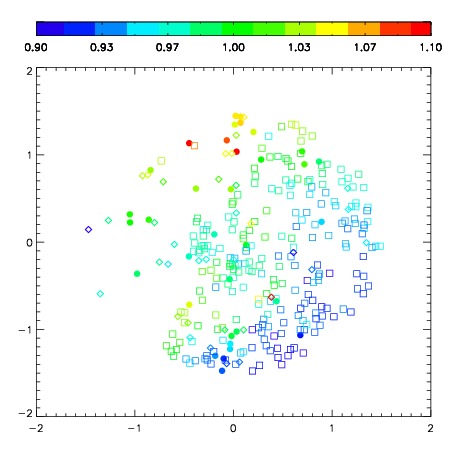
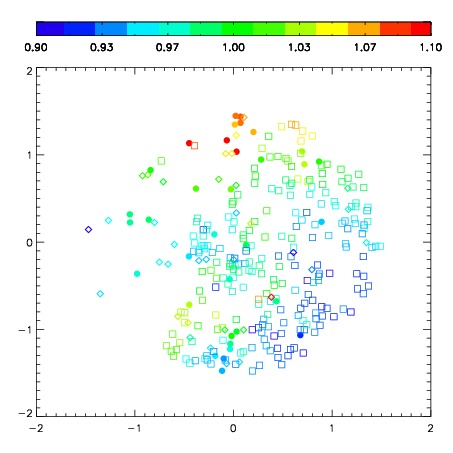
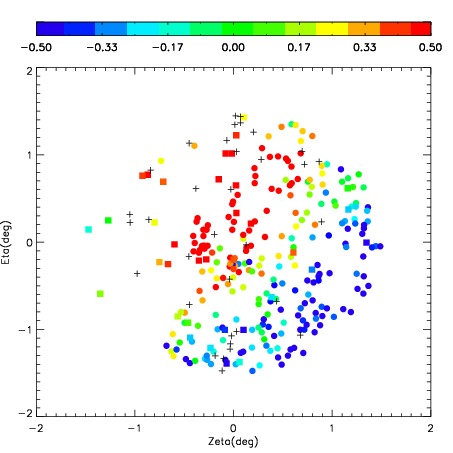
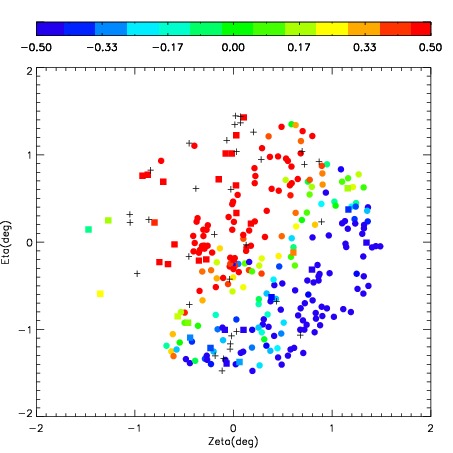
| Spatial sky telluric CO2 absorption deviations (filled: H < 10)
|
| 2530017
| 47
| | Red | Green | Blue
| | z | | 18.37
| | znorm | | 14.19
| | sky | 14.4 | 14.1 | 14.1
| | S/N | 10.3 | 18.3 | 19.2
| | S/N(c) | 8.8 | 16.7 | 17.8
| | SN(E/C) 0.70
|
| 
| 
| 
| 
| 
|
| 2530018
| 47
| | Red | Green | Blue
| | z | | 18.27
| | znorm | | 14.09
| | sky | 14.5 | 14.4 | 14.4
| | S/N | 9.5 | 17.3 | 18.0
| | S/N(c) | 8.4 | 15.8 | 16.7
| | SN(E/C) 0.76
|
| 
| 
| 
| 
| 
|
| 2530019
| 47
| | Red | Green | Blue
| | z | | 18.18
| | znorm | | 14.00
| | sky | 14.3 | 14.5 | 14.5
| | S/N | 9.0 | 16.1 | 17.6
| | S/N(c) | 7.9 | 14.9 | 16.4
| | SN(E/C) 0.74
|
| 
| 
| 
| 
| 
|
| 2530020
| 47
| | Red | Green | Blue
| | z | | 18.40
| | znorm | | 14.22
| | sky | 14.7 | 14.6 | 14.6
| | S/N | 10.7 | 19.0 | 20.5
| | S/N(c) | 9.3 | 18.0 | 18.9
| | SN(E/C) 0.72
|
| 
| 
| 
| 
| 
|
| 2530021
| 47
| | Red | Green | Blue
| | z | | 18.27
| | znorm | | 14.09
| | sky | 14.7 | 14.6 | 14.6
| | S/N | 9.6 | 17.1 | 19.1
| | S/N(c) | 8.4 | 15.8 | 17.6
| | SN(E/C) 0.73
|
| 
| 
| 
| 
| 
|
| 2530022
| 47
| | Red | Green | Blue
| | z | | 18.18
| | znorm | | 14.00
| | sky | 14.5 | 14.6 | 14.6
| | S/N | 9.4 | 16.4 | 19.1
| | S/N(c) | 8.1 | 15.4 | 17.6
| | SN(E/C) 0.69
|
| 
| 
| 
| 
| 
|
| 2530023
| 47
| | Red | Green | Blue
| | z | | 18.11
| | znorm | | 13.93
| | sky | 14.8 | 14.7 | 14.7
| | S/N | 9.0 | 16.4 | 18.8
| | S/N(c) | 8.0 | 15.7 | 17.2
| | SN(E/C) 0.64
|
| 
| 
| 
| 
| 
|
| 2530024
| 47
| | Red | Green | Blue
| | z | | 17.94
| | znorm | | 13.76
| | sky | 14.8 | 14.8 | 14.7
| | S/N | 7.9 | 14.8 | 16.3
| | S/N(c) | 6.9 | 13.9 | 15.0
| | SN(E/C) 0.71
|
| 
| 
| 
| 
| 
|

