| Red | Green | Blue | |
| z | 17.64 | ||
| znorm | Inf | ||
| sky | -Inf | -Inf | -Inf |
| S/N | 14.4 | 26.7 | 29.5 |
| S/N(c) | 0.0 | 0.0 | 0.0 |
| SN(E/C) |


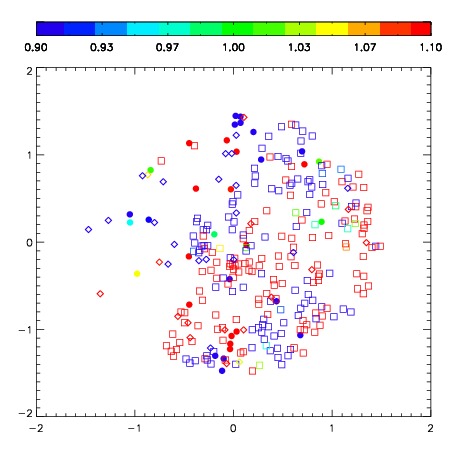


| Frame | Nreads | Zeropoints | Mag plots | Spatial mag deviation | Spatial sky 16325A emission deviations (filled: sky, open: star) | Spatial sky continuum emission | Spatial sky telluric CO2 absorption deviations (filled: H < 10) | |||||||||||||||||||||||
| 0 | 0 |
|
|
|
|
|
|
| IPAIR | NAME | SHIFT | NEWSHIFT | S/N | NAME | SHIFT | NEWSHIFT | S/N |
| 0 | 02530019 | 0.310157 | 0.00000 | 210.386 | 02530024 | -0.0162753 | 0.326432 | 212.564 |
| 1 | 02530023 | 0.298665 | 0.0114920 | 232.573 | 02530020 | -0.0204403 | 0.330597 | 240.834 |
| 2 | 02530022 | 0.297591 | 0.0125660 | 230.723 | 02530021 | -0.0205806 | 0.330738 | 235.934 |
| 3 | 02530018 | 0.309218 | 0.000939012 | 214.090 | 02530017 | 0.00000 | 0.310157 | 228.833 |