| Red | Green | Blue | |
| z | 17.64 | ||
| znorm | Inf | ||
| sky | -Inf | -Inf | -Inf |
| S/N | 13.1 | 26.3 | 32.0 |
| S/N(c) | 0.0 | 0.0 | 0.0 |
| SN(E/C) |
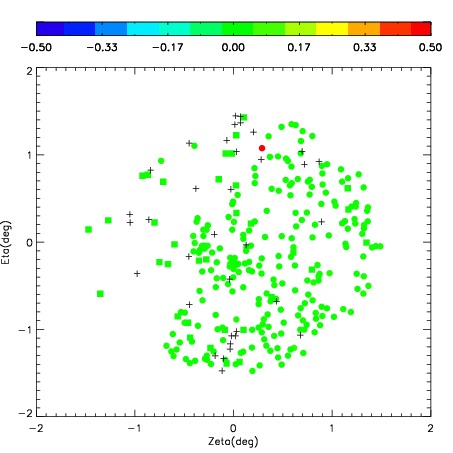
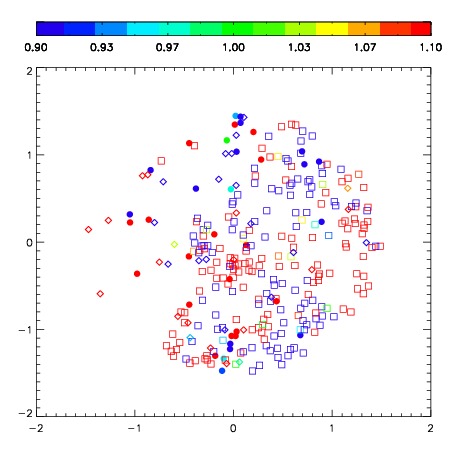
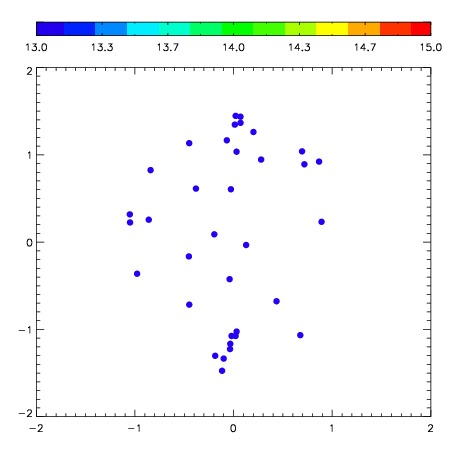
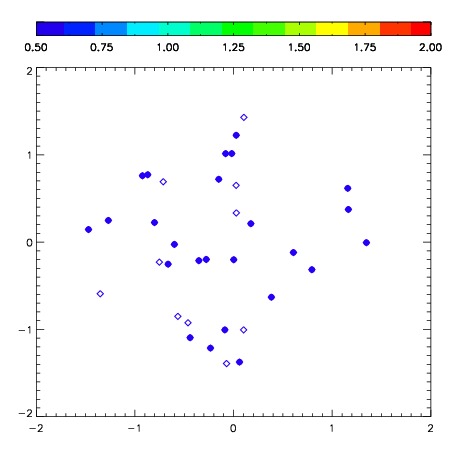
| Frame | Nreads | Zeropoints | Mag plots | Spatial mag deviation | Spatial sky 16325A emission deviations (filled: sky, open: star) | Spatial sky continuum emission | Spatial sky telluric CO2 absorption deviations (filled: H < 10) | |||||||||||||||||||||||
| 0 | 0 |
|
|
|
|
|
|
| IPAIR | NAME | SHIFT | NEWSHIFT | S/N | NAME | SHIFT | NEWSHIFT | S/N |
| 0 | 02600065 | 0.397406 | 0.00000 | 183.476 | 02600059 | 0.00000 | 0.397406 | 178.400 |
| 1 | 02600064 | 0.397124 | 0.000282019 | 198.825 | 02600063 | 0.0197269 | 0.377679 | 200.350 |
| 2 | 02600061 | 0.391351 | 0.00605500 | 195.956 | 02600062 | 0.0200761 | 0.377330 | 199.001 |
| 3 | 02600060 | 0.396205 | 0.00120100 | 191.531 | 02600066 | 0.0210697 | 0.376336 | 189.563 |