| Red | Green | Blue | |
| z | 17.64 | ||
| znorm | Inf | ||
| sky | -Inf | -Inf | -Inf |
| S/N | 16.4 | 30.5 | 33.3 |
| S/N(c) | 0.0 | 0.0 | 0.0 |
| SN(E/C) |

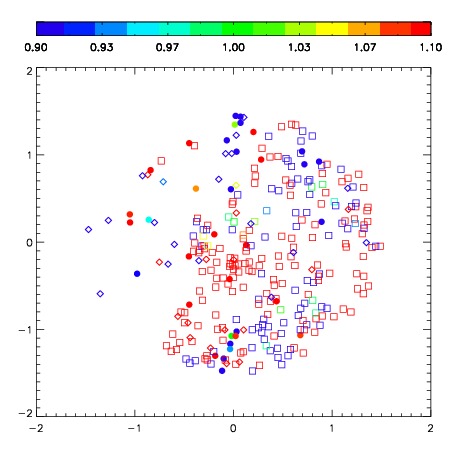
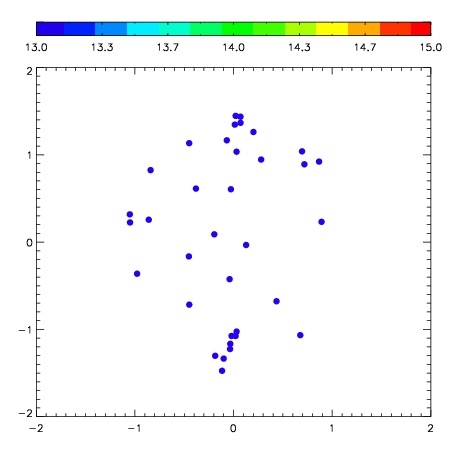
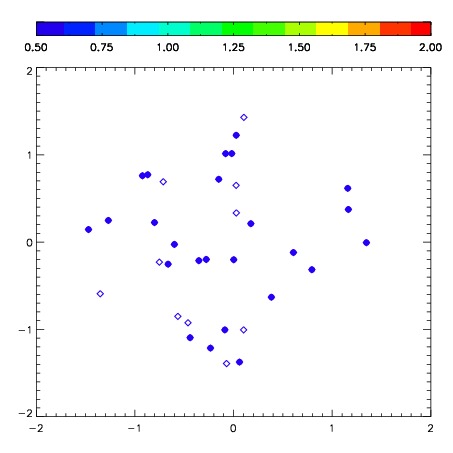
| Frame | Nreads | Zeropoints | Mag plots | Spatial mag deviation | Spatial sky 16325A emission deviations (filled: sky, open: star) | Spatial sky continuum emission | Spatial sky telluric CO2 absorption deviations (filled: H < 10) | |||||||||||||||||||||||
| 0 | 0 |
|
|
|
|
|
|
| IPAIR | NAME | SHIFT | NEWSHIFT | S/N | NAME | SHIFT | NEWSHIFT | S/N |
| 0 | 02790042 | 0.426251 | 0.00000 | 204.062 | 02790040 | 0.0376455 | 0.388606 | 192.867 |
| 1 | 02790038 | 0.424611 | 0.00163999 | 214.700 | 02790043 | 0.0379700 | 0.388281 | 216.268 |
| 2 | 02790037 | 0.426041 | 0.000209987 | 204.807 | 02790036 | 0.00000 | 0.426251 | 196.084 |
| 3 | 02790041 | 0.421563 | 0.00468799 | 198.321 | 02790039 | 0.0387878 | 0.387463 | 192.000 |